
Water changes phase according to temperature and pressure. These qualitative diagrams introduce boundaries, special points and the effect of pressure on boiling.
Choose from five images below. Open an image for a closer look, download its original PNG, or download all five as a ZIP.
Use these visuals in your lesson
Trace a constant-pressure heating path and distinguish crossing a boundary from moving within one phase.
A question to discuss
Why can ice sublime without becoming liquid below the triple-point pressure?
Water phase diagram: five teaching visuals
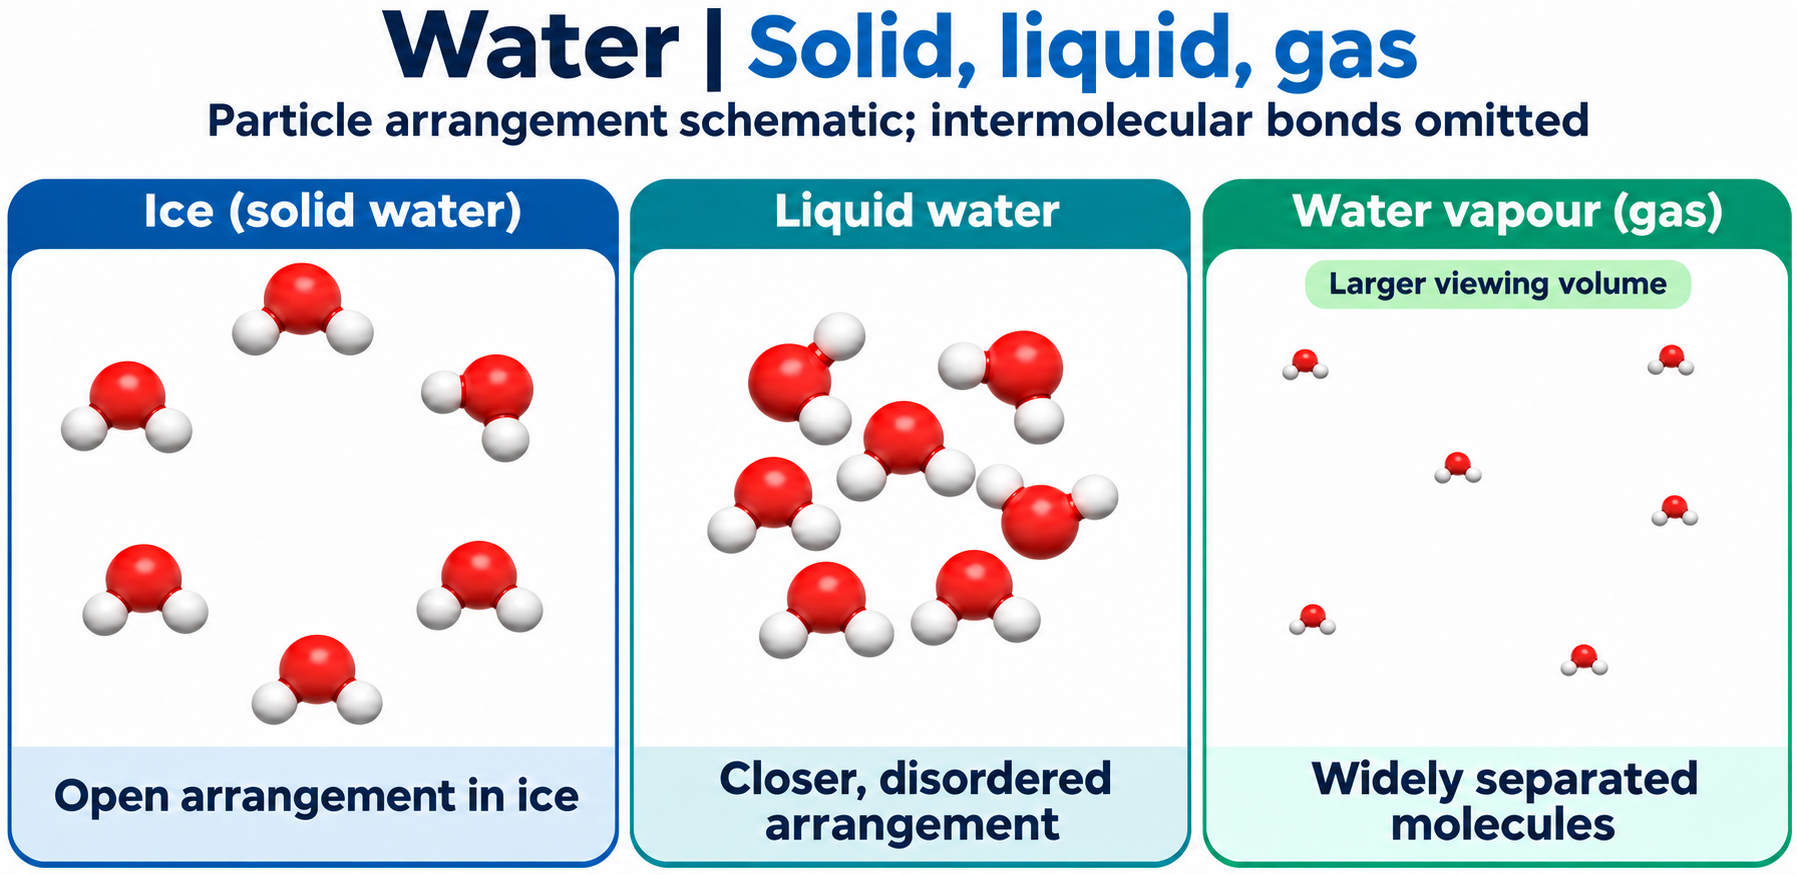
Water in three states
Water in three states
Schematic water molecules compare an open ice arrangement, closer disordered liquid and widely separated vapour.
Download original PNG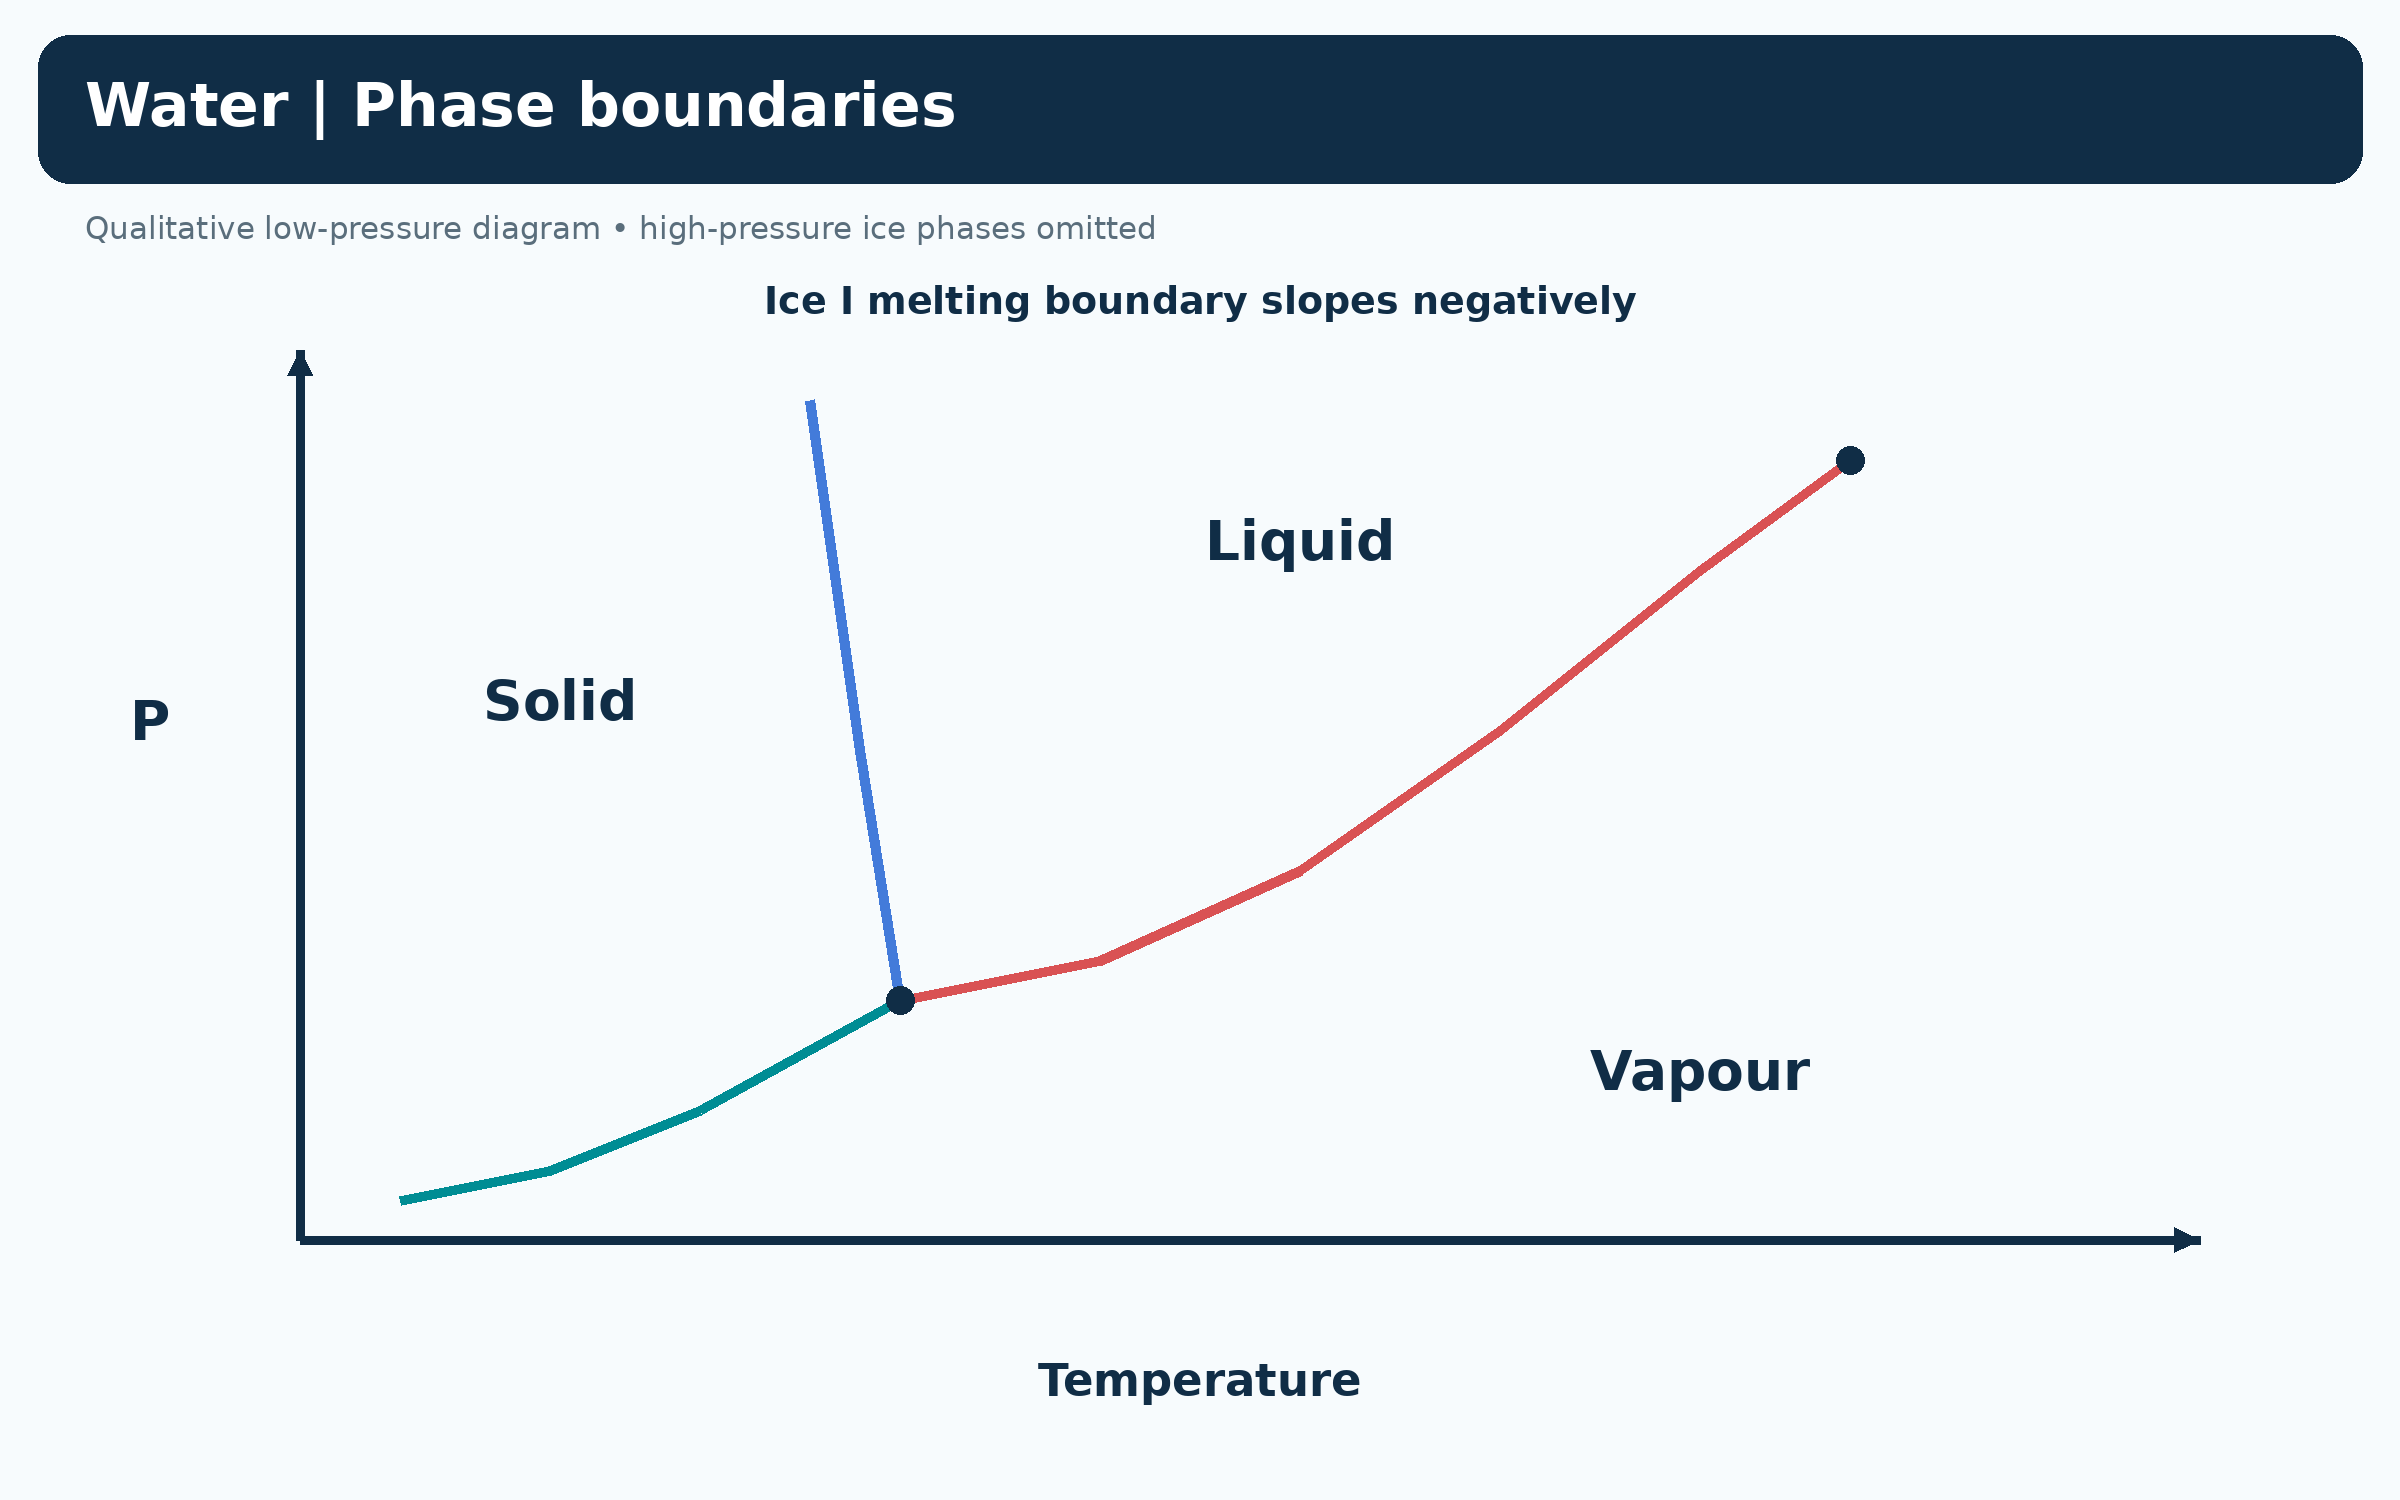
Water phase boundaries
Water phase boundaries
A qualitative low-pressure diagram shows solid, liquid and vapour, with a negatively sloping ice-I melting boundary.
Download original PNG
Triple and critical points
Triple and critical points
A qualitative phase diagram labels water reference triple and critical temperatures and pressures.
Download original PNG
Heating at different pressures
Heating at different pressures
Two paths contrast melting then boiling above the triple point with sublimation below its pressure.
Download original PNG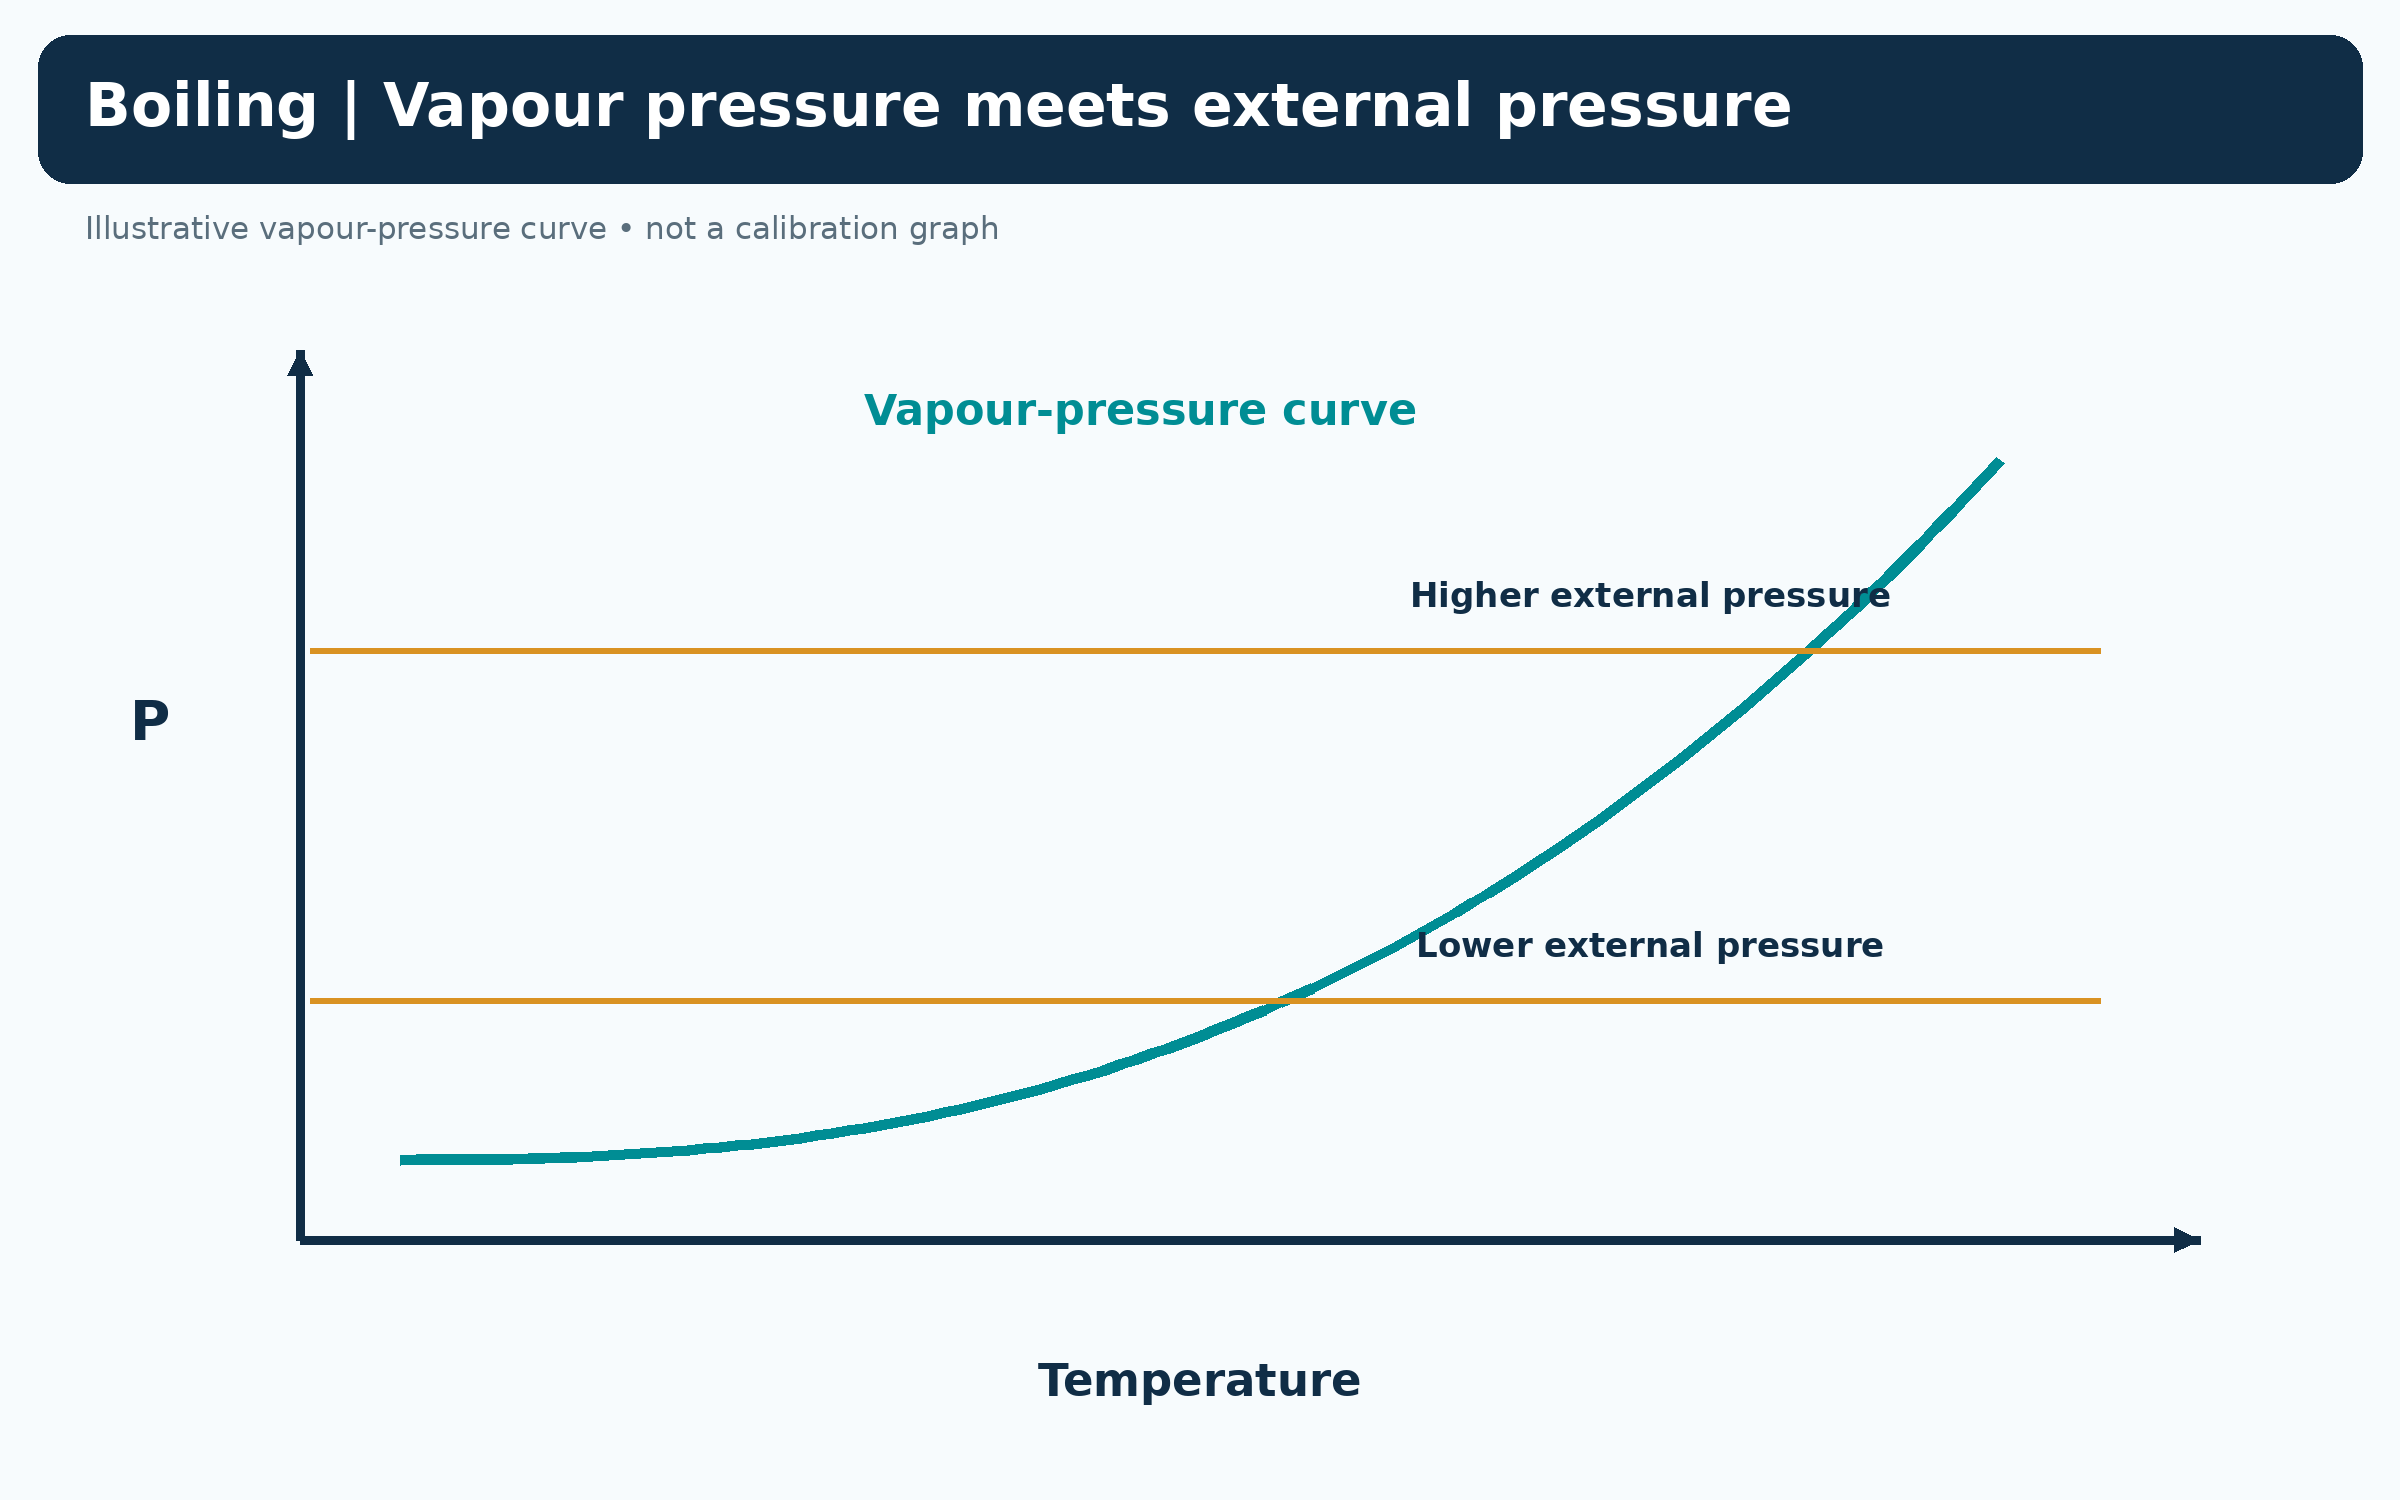
Boiling and external pressure
Boiling and external pressure
A qualitative vapour-pressure curve meets two external pressures at different boiling temperatures.
Download original PNGAbout these representations
Qualitative low-pressure phase diagrams with IAPWS reference points; high-pressure ice phases omitted.