
Explore changes in membrane potential and the ion movements associated with an action potential. These views support a sequence in which channel behaviour and voltage changes are connected.
Choose from five images below. Open an image for a closer look, download its original PNG, or download all five as a ZIP.
Use these visuals in your lesson
Read the axes before interpreting the curve. Ask students to name the dominant ion movement during each phase without confusing electrical change with a whole neuron moving.
A question to discuss
What is the difference between depolarisation and repolarisation?
Action potentials: five teaching visuals

A brief voltage spike
A representative action-potential curve marks threshold, depolarisation, repolarisation and undershoot.
Download original PNG
Ion flow changes voltage
Channel states and ion movements are compared during depolarisation, repolarisation and after-hyperpolarisation.
Download original PNG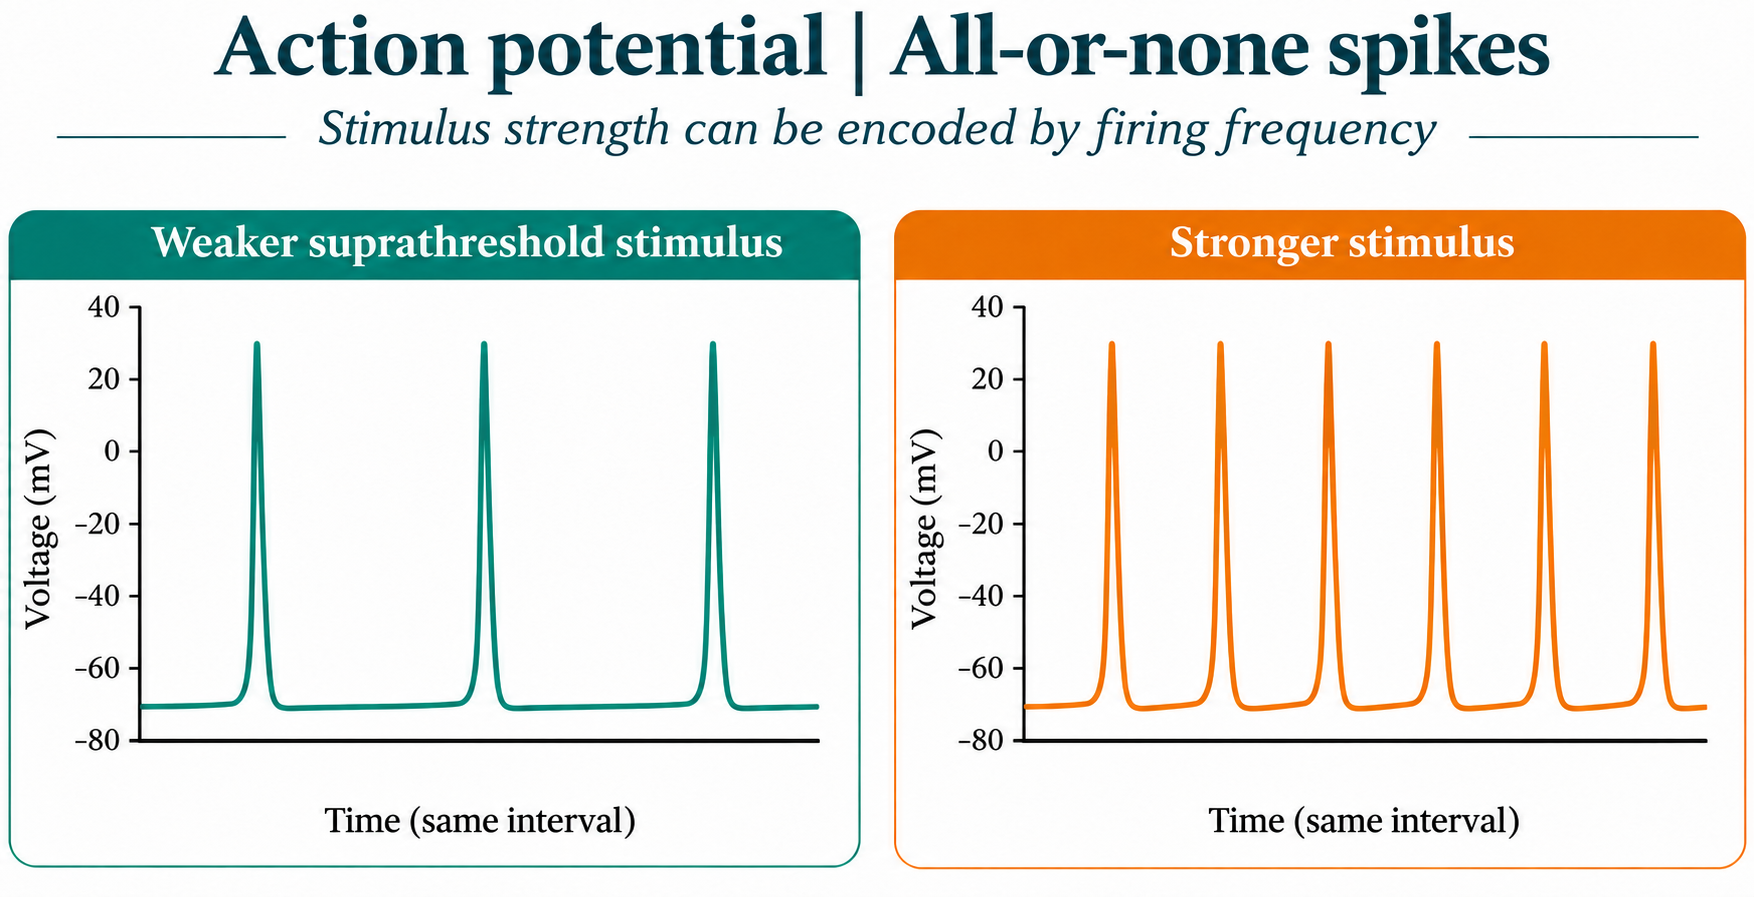
All-or-none spikes
Illustrative traces show a stronger stimulus encoded by higher firing frequency rather than larger spikes.
Download original PNG
Refractory periods
A representative trace distinguishes absolute and relative refractory periods.
Download original PNG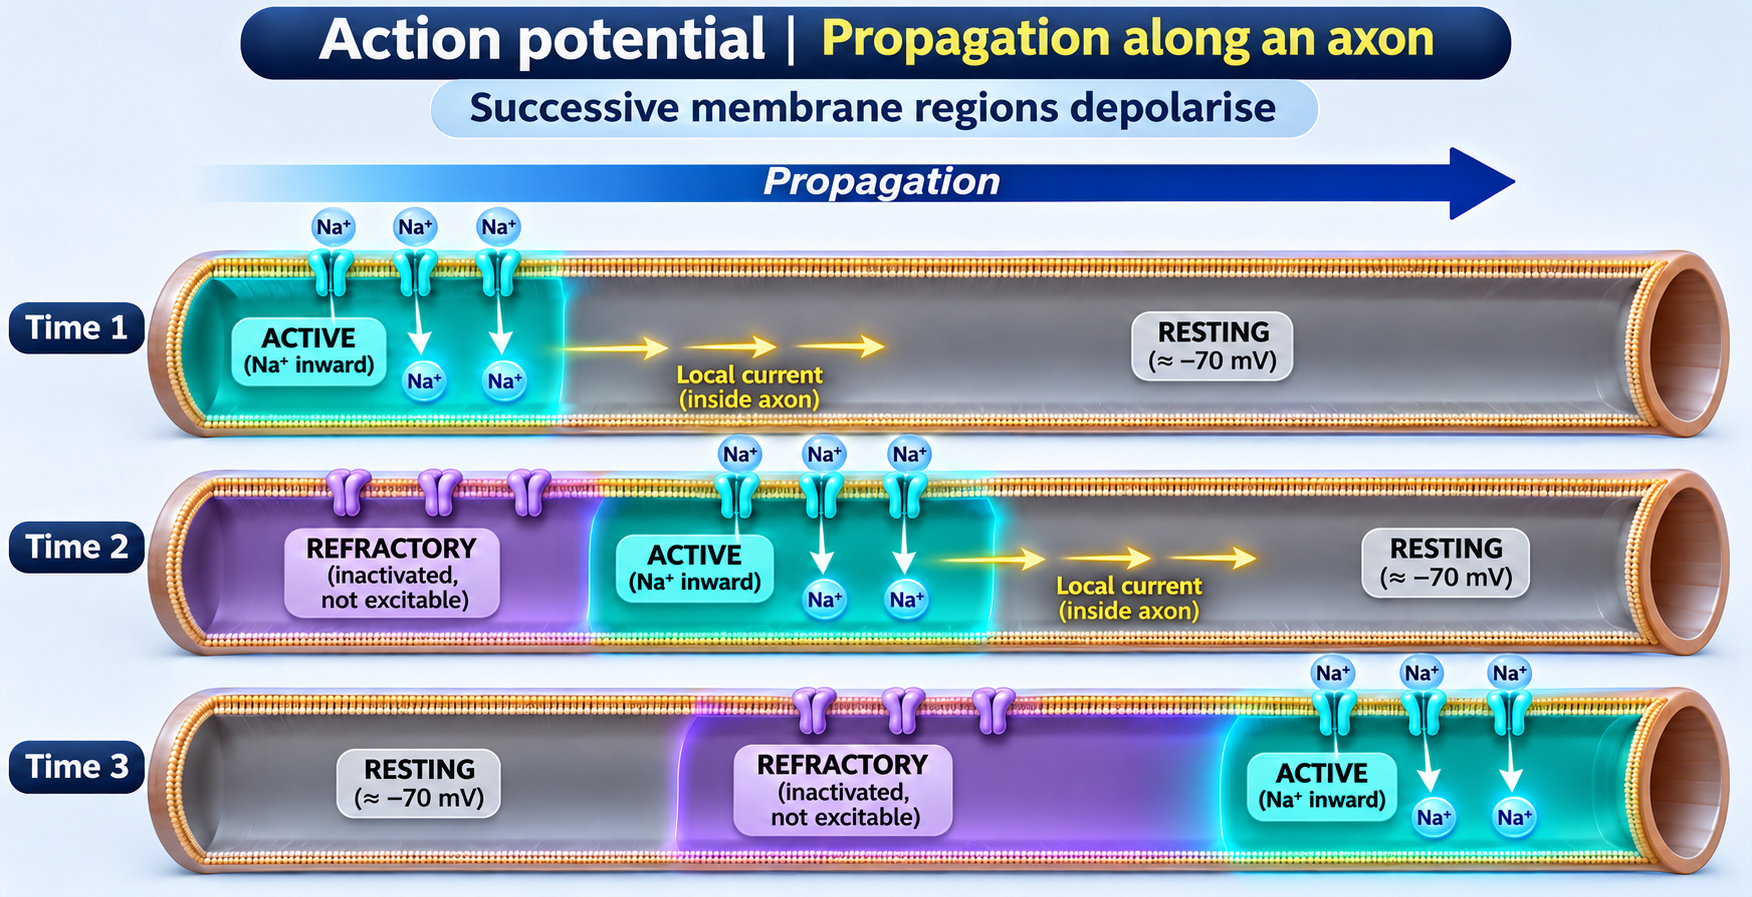
Propagation along an axon
Successive axon regions depolarise as local currents spread and recently active regions become refractory.
Download original PNG