
Use qualitative energy profiles to separate activation energy from the overall energy change of a reaction. The images also connect catalysis with reaction rates and the approach to equilibrium.
Choose from five images below. Open an image for a closer look, download its original PNG, or download all five as a ZIP.
Use these visuals in your lesson
Ask students to mark reactants, products and the activation barrier before adding the catalysed pathway. Keep the energy axis distinct from a timeline.
A question to discuss
What changes when a catalyst is added, and what stays the same?
Activation energy: five teaching visuals

A lower barrier
Catalysed and uncatalysed pathways share reactant and product energies.
Download original PNG
Reading the profile
Compare activation barriers while keeping the overall free-energy change unchanged.
Download original PNG
Both directions accelerate
An enzyme lowers forward and reverse activation barriers.
Download original PNG
Energy change stays the same
Catalysis in exergonic and endergonic reactions does not alter the overall energy change.
Download original PNG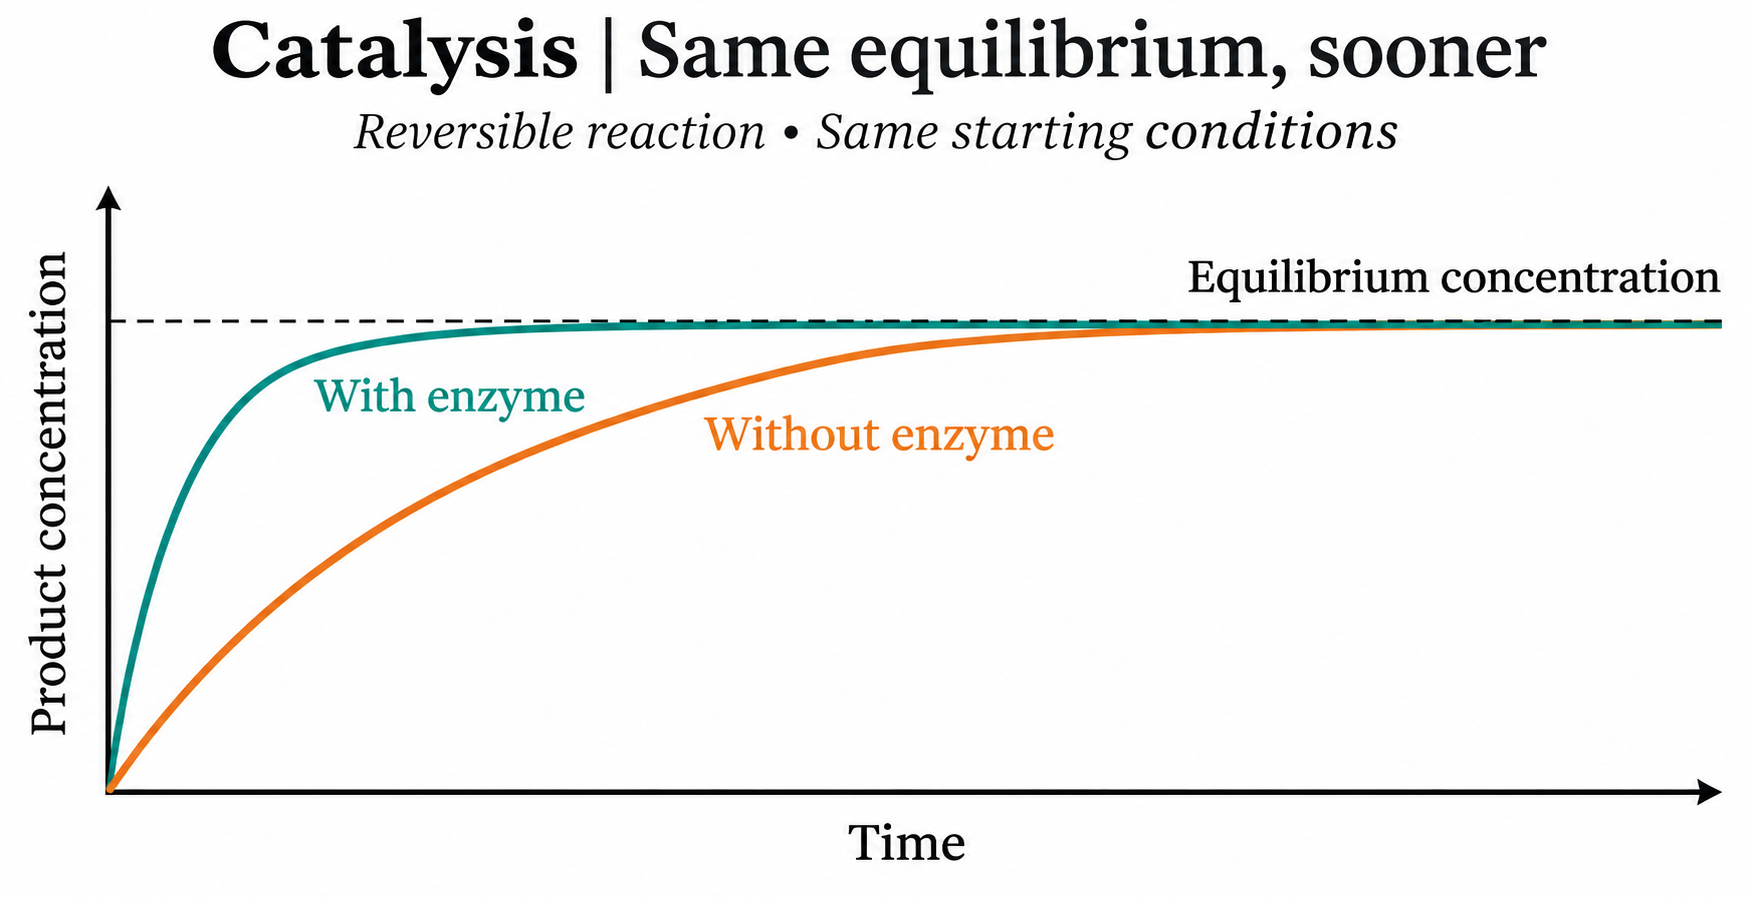
Same equilibrium sooner
Qualitative concentration curves approach the same equilibrium with and without enzyme.
Download original PNG