
Connect antibody organisation with binding and immune function. The collection includes a deposited 1IGT structural representation alongside teaching views.
Choose from five images below. Open an image for a closer look, download its original PNG, or download all five as a ZIP.
Use these visuals in your lesson
Identify antigen-binding regions before discussing specificity. Compare simplified and molecular views to explain how representations highlight different features.
A question to discuss
Why does binding specificity depend on the structure of the antigen-binding region?
Antibody structure: five teaching visuals

Two binding sites
An IgG diagram identifies heavy chains, light chains, antigen-binding sites and the Fc region.
Download original PNG
Variable and constant regions
An IgG domain map distinguishes variable regions, constant regions, Fab, Fc and the hinge.
Download original PNG
Chains held together
Selected interchain disulfide bonds connect the heavy and light chains of IgG.
Download original PNG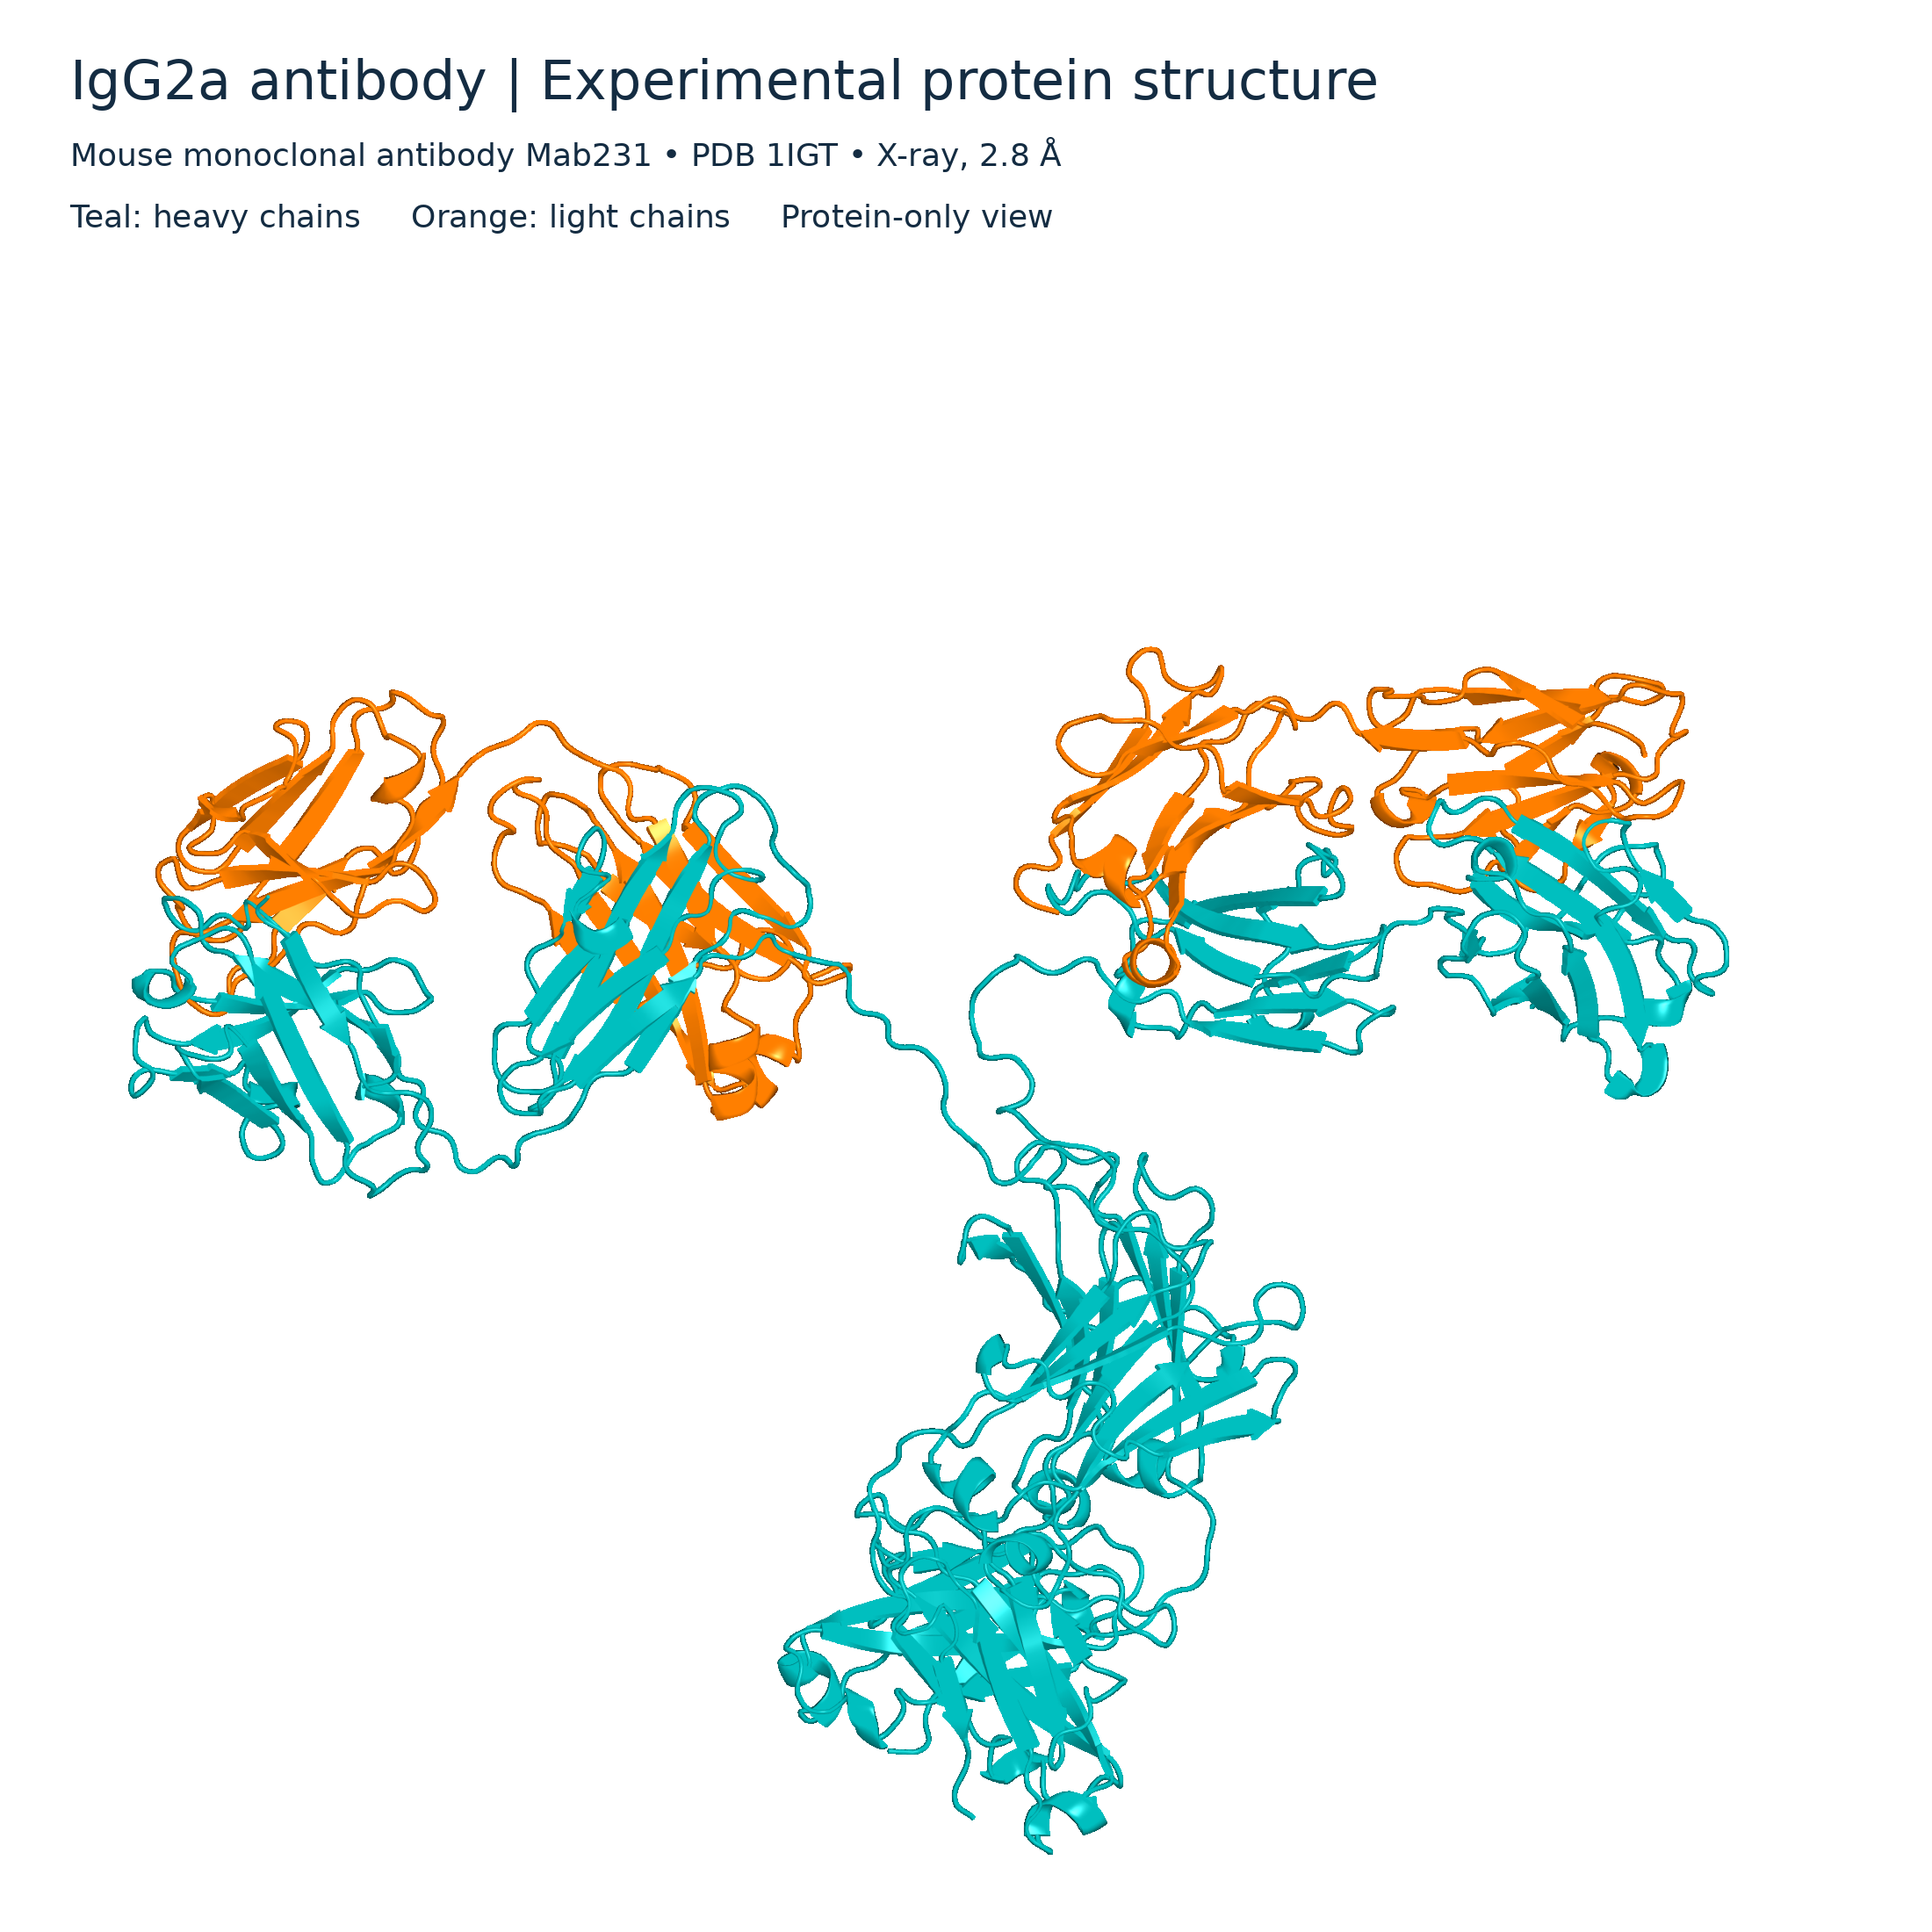
IgG2a ribbon model
Protein-only ribbon view of mouse monoclonal antibody Mab231 from PDB 1IGT, with heavy and light chains coloured separately.
Download original PNG
IgG2a molecular surface
Protein-only surface view of the PDB 1IGT antibody structure, with heavy chains in teal and light chains in orange.
Download original PNG