
Use blood glucose regulation to explain negative feedback and coordinated responses. The images connect changes in glucose concentration with hormonal signals and target tissues.
Choose from five images below. Open an image for a closer look, download its original PNG, or download all five as a ZIP.
Use these visuals in your lesson
Start with a rise or fall in glucose, then ask students to build the response step by step. End by explaining why the original stimulus is reduced.
A question to discuss
Why is this regulation described as negative feedback rather than positive feedback?
Blood glucose homeostasis: five teaching visuals

Two balancing hormones
Negative-feedback loops link blood glucose with insulin and glucagon secretion.
Download original PNG
After a meal
Insulin supports glucose uptake in muscle and adipose tissue and glycogen synthesis in the liver.
Download original PNG
Between meals
Glucagon supports hepatic glucose production through glycogenolysis and gluconeogenesis.
Download original PNG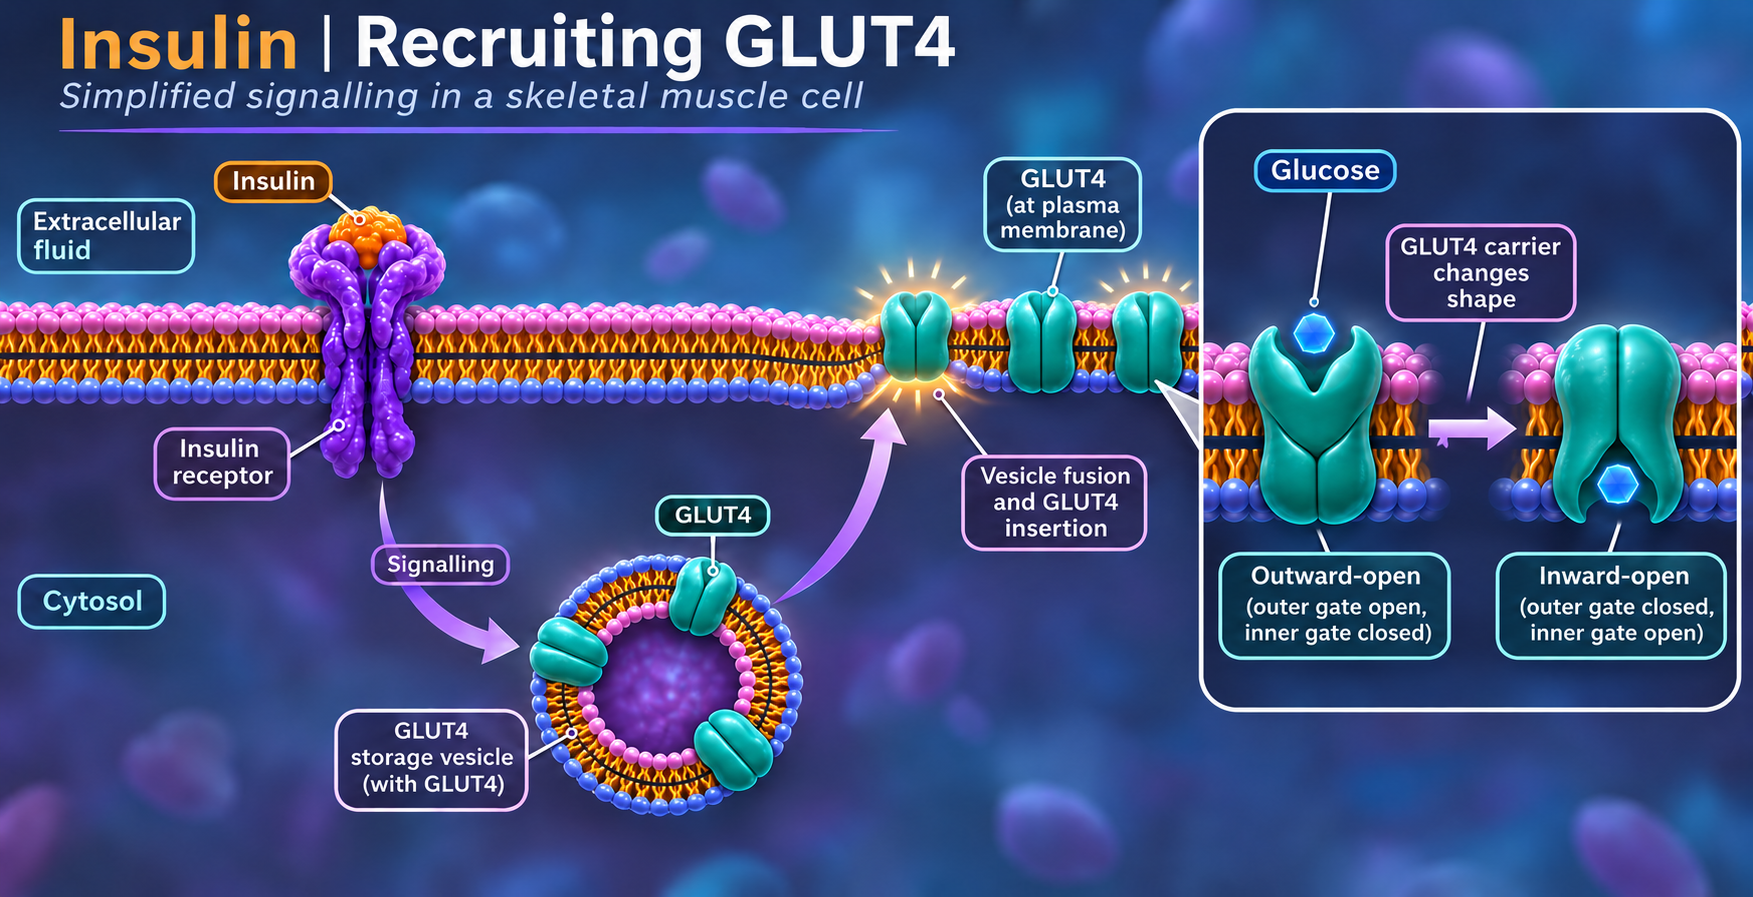
Recruiting GLUT4
A simplified muscle-cell model shows insulin signalling and GLUT4 insertion into the cell membrane.
Download original PNG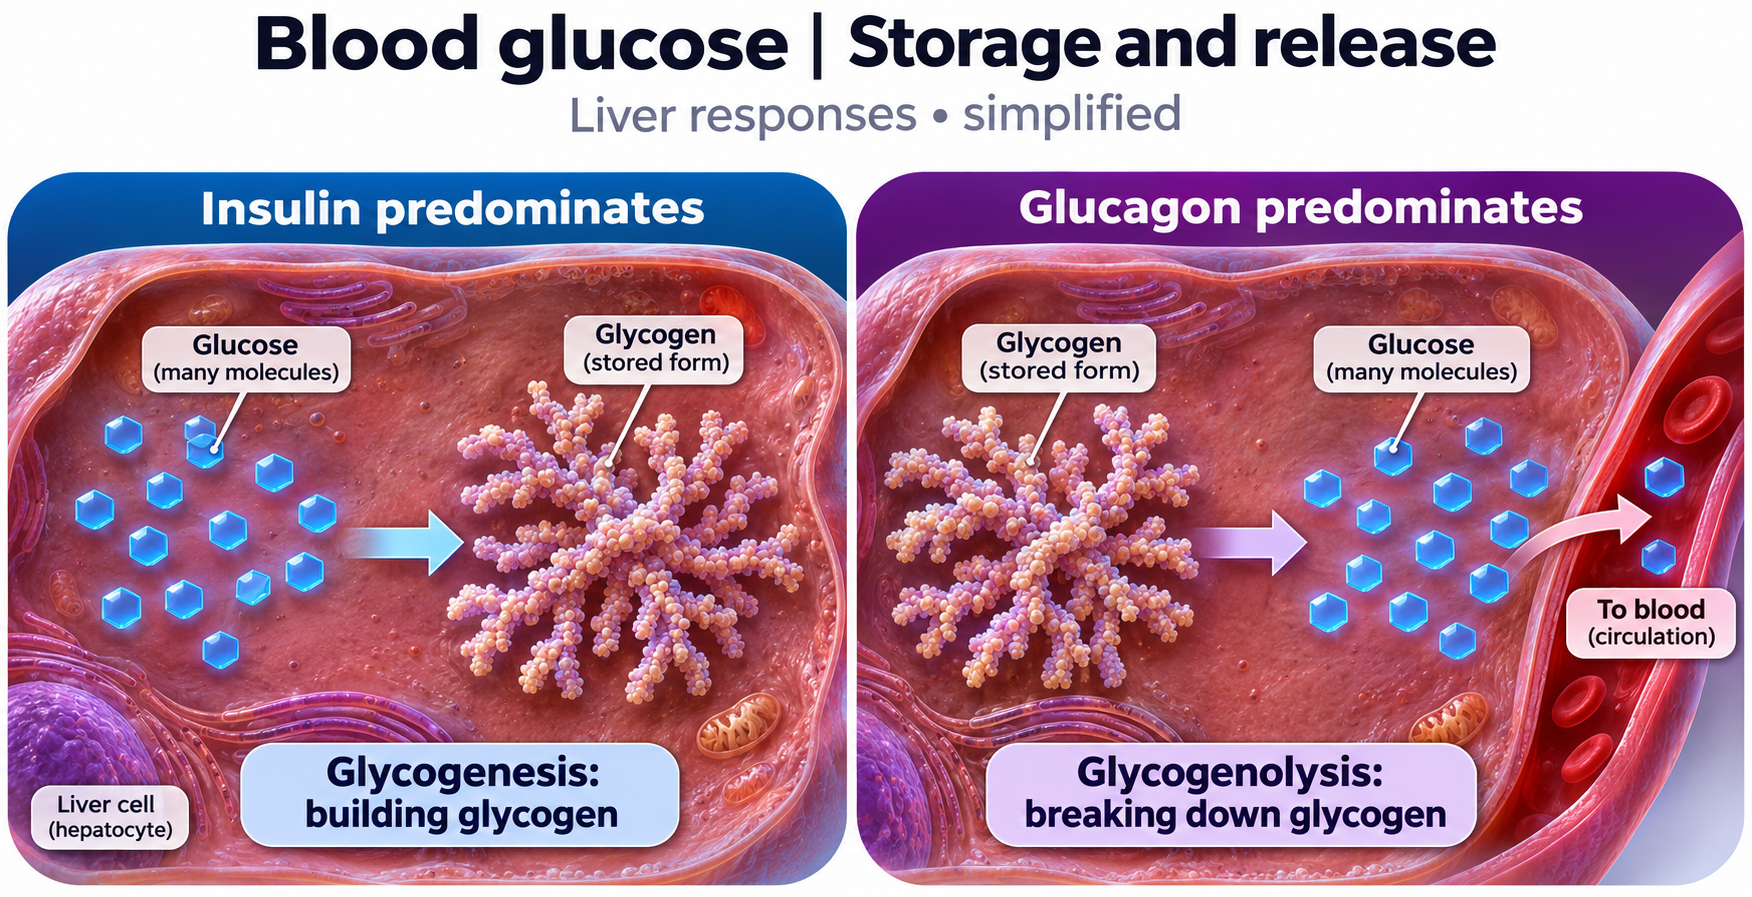
Storage and release
Liver-cell views compare glycogen synthesis and glycogen breakdown.
Download original PNG