
Atoms absorb or emit photons when they change between allowed energy levels. Line spectra connect these energy gaps with characteristic wavelengths.
Choose from five images below. Open an image for a closer look, download its original PNG, or download all five as a ZIP.
Use these visuals in your lesson
Match upward and downward transitions before using the hydrogen lines to compare emission with absorption.
A question to discuss
How does a larger energy gap affect photon wavelength?
Atomic emission and absorption: five teaching visuals
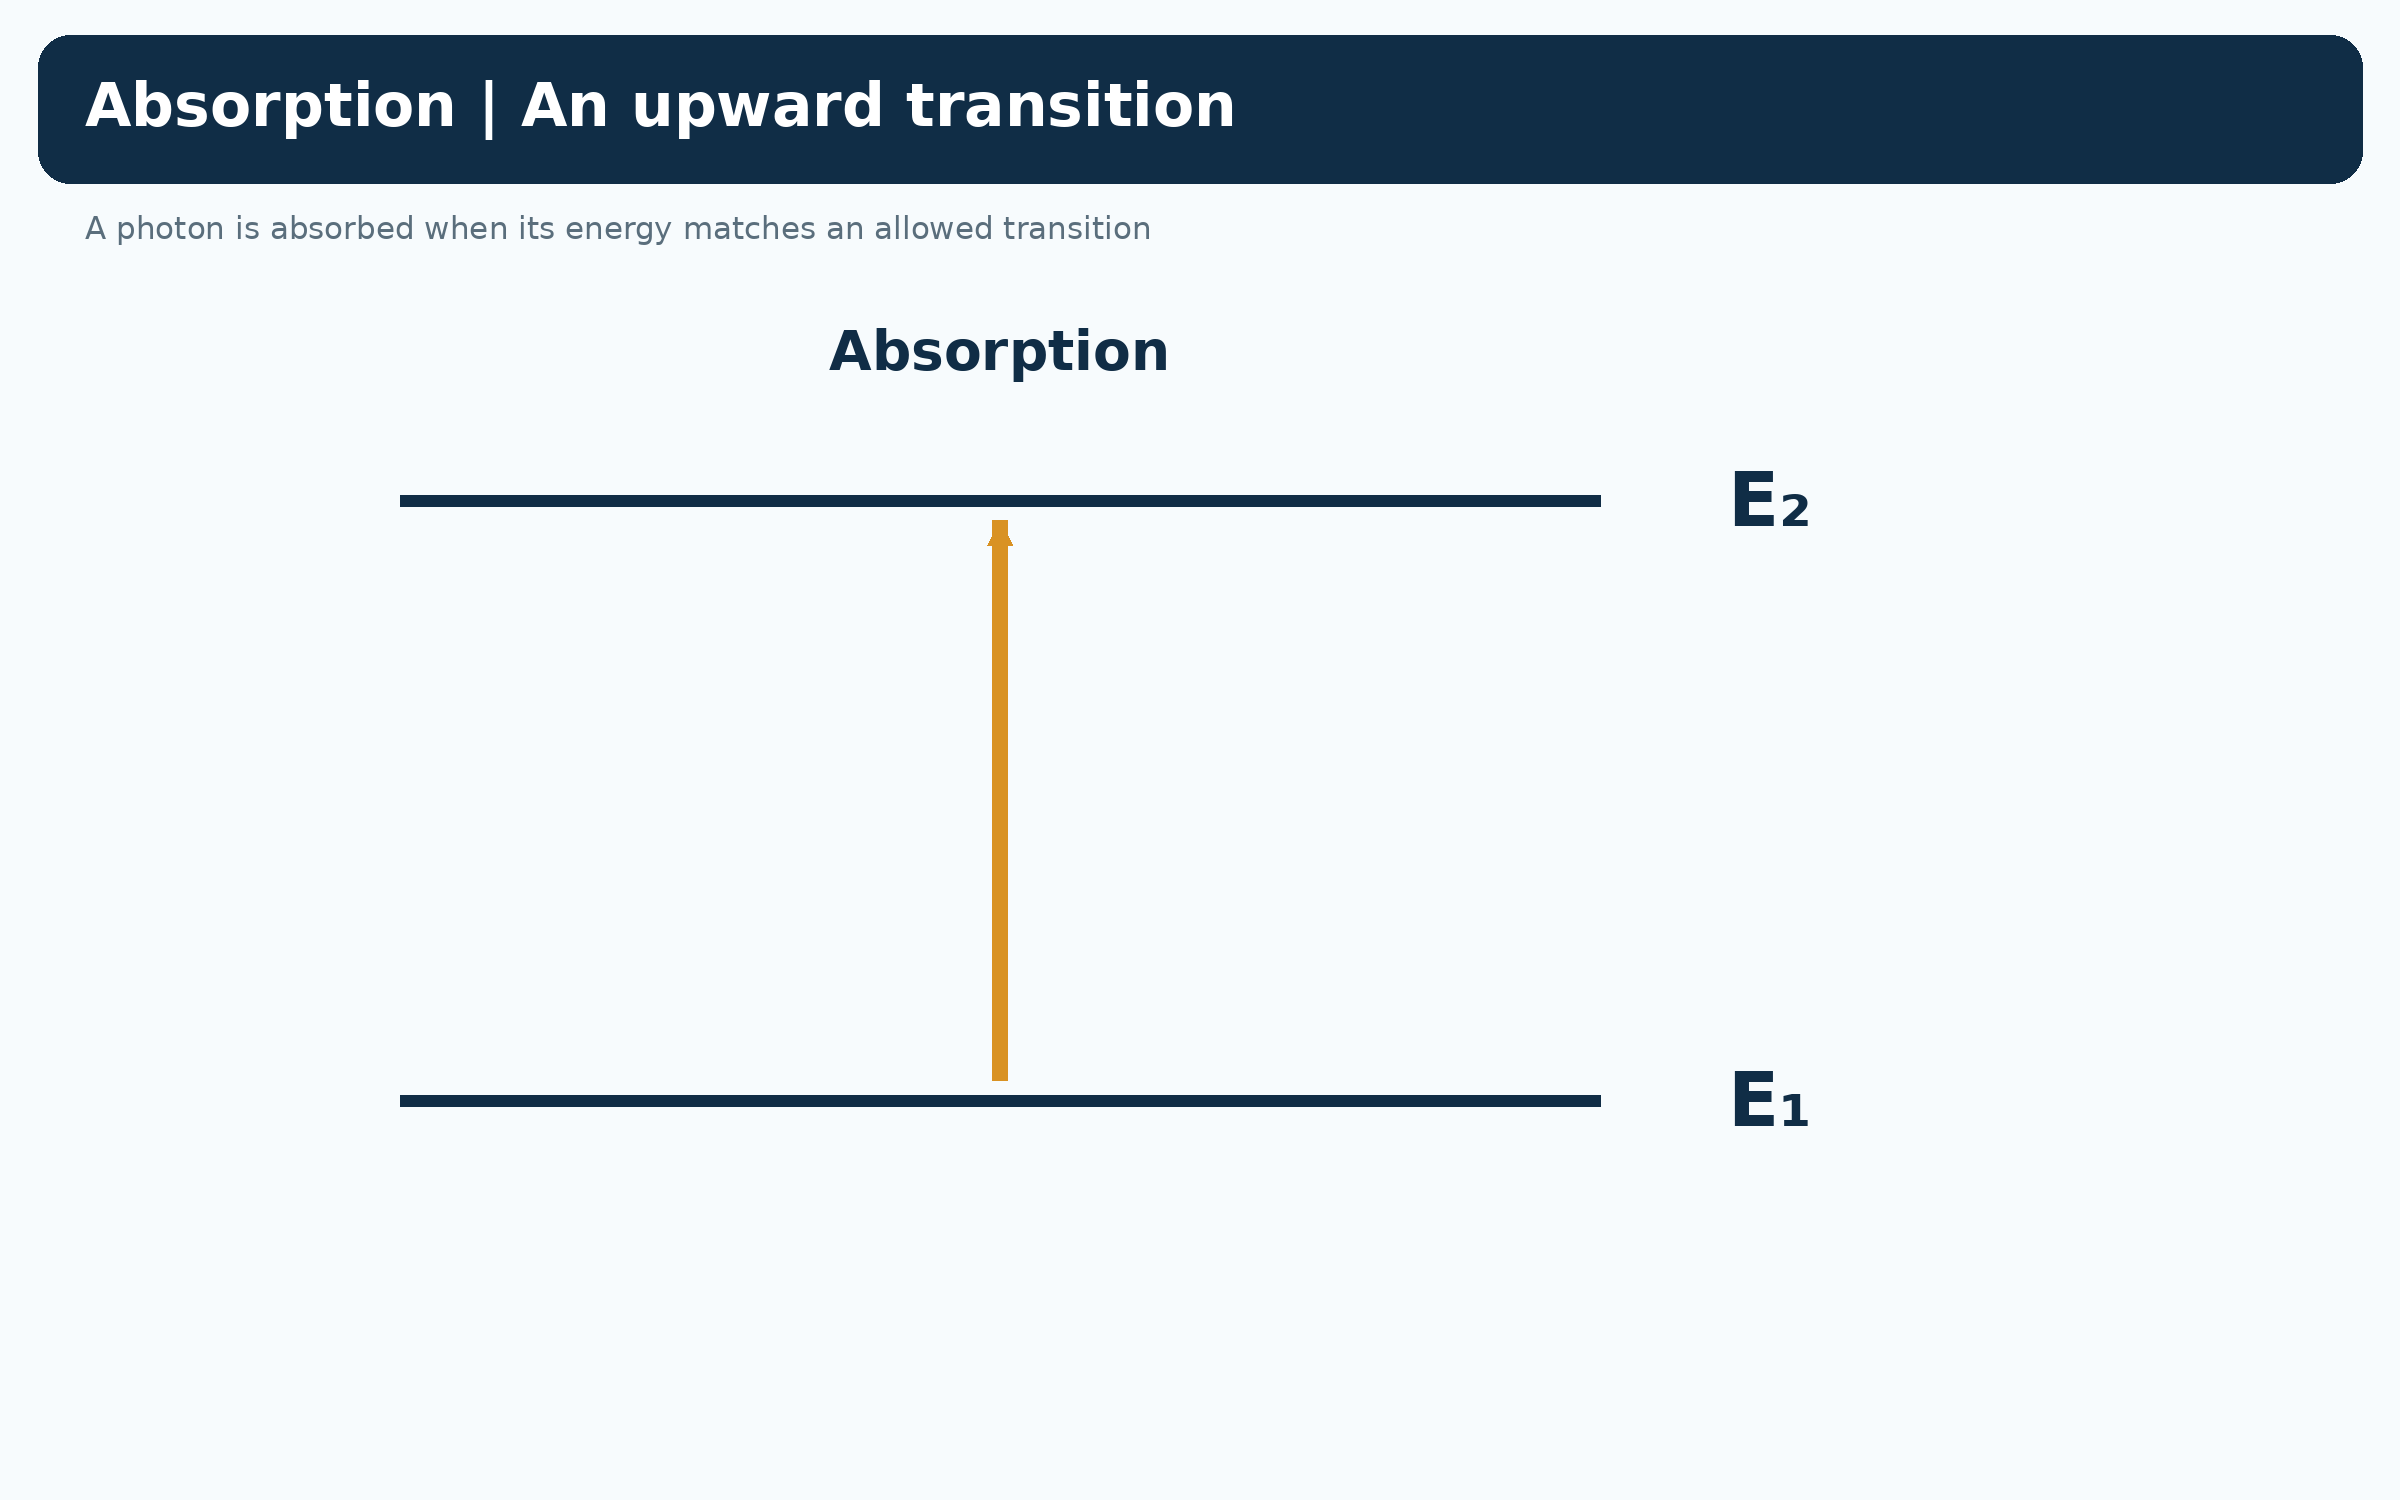
Absorption raises atomic energy
Absorption raises atomic energy
An upward arrow connects lower level E1 to higher level E2 when a matching photon is absorbed.
Download original PNG
Emission lowers atomic energy
Emission lowers atomic energy
A downward arrow connects E2 to E1 as the atom emits a photon.
Download original PNG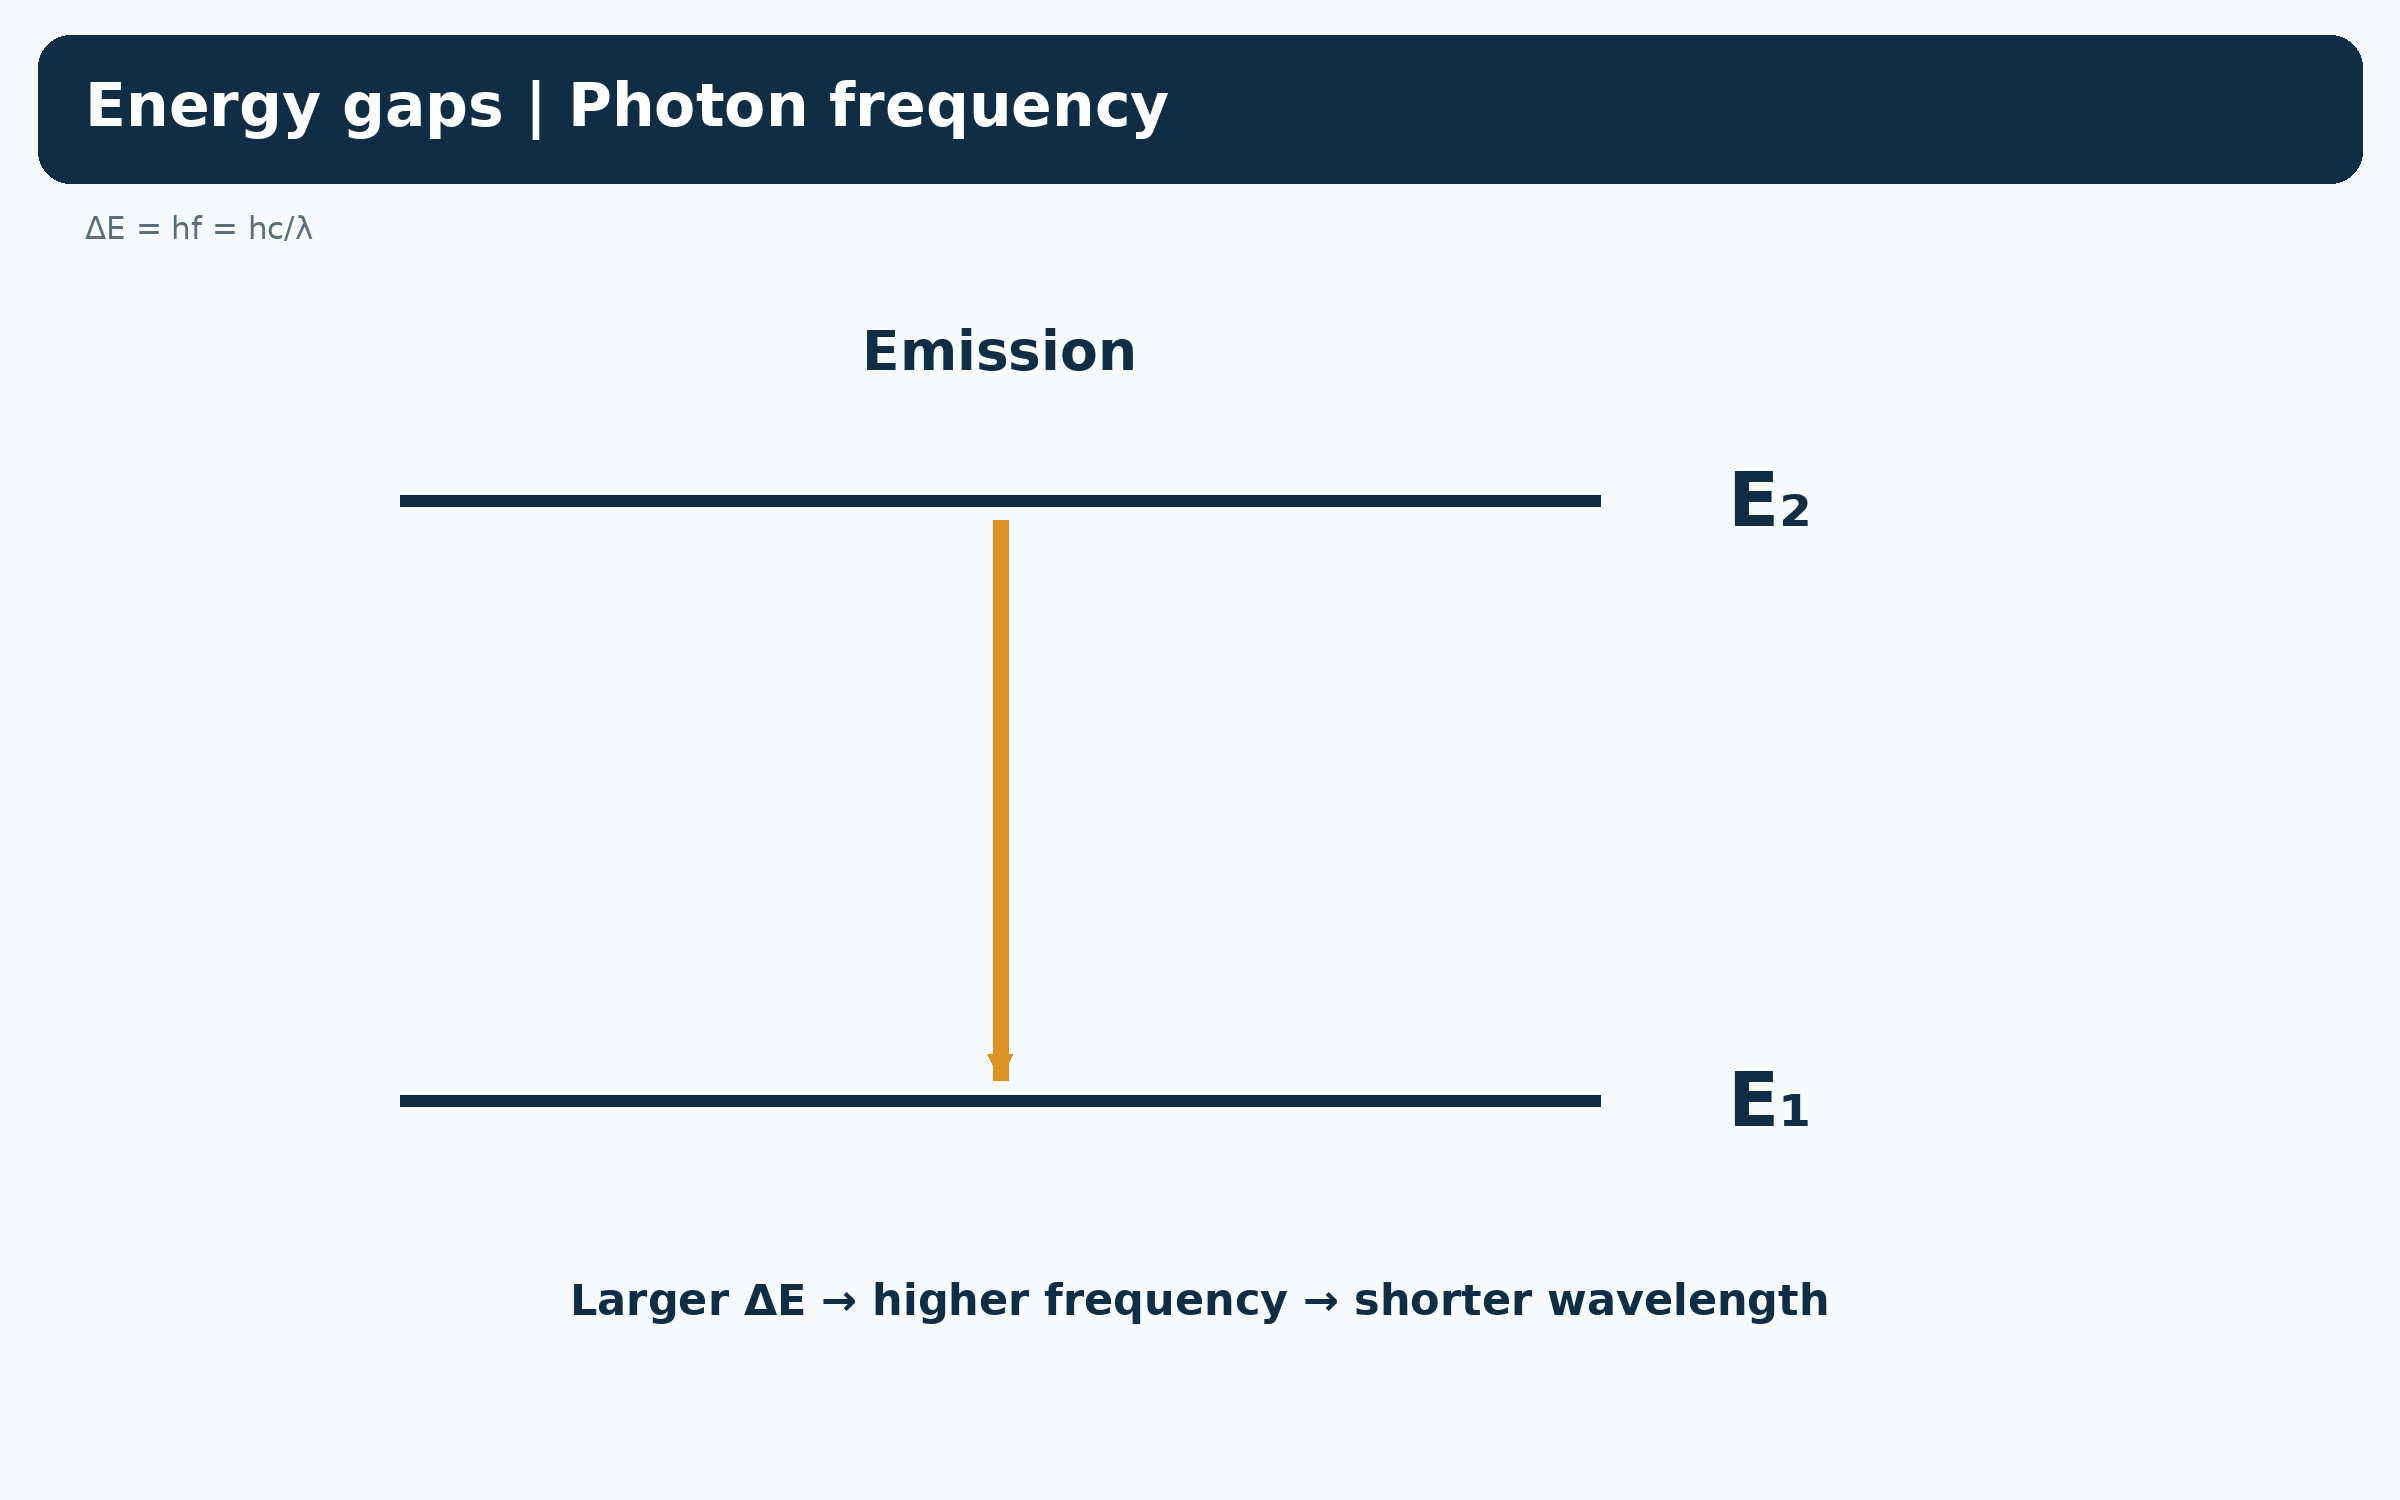
Energy gap and photon wavelength
Energy gap and photon wavelength
An emission diagram relates energy gap to hf and hc/lambda: larger gaps mean shorter wavelengths.
Download original PNG
Visible hydrogen Balmer lines
Visible hydrogen Balmer lines
Four illustrative lines are labelled with approximate air wavelengths 410.17, 434.05, 486.13 and 656.28 nm.
Download original PNG
Emission and absorption lines
Emission and absorption lines
Bright emission lines and dark absorption lines align at matching characteristic wavelengths.
Download original PNGAbout these representations
Approximate hydrogen Balmer wavelengths in air from NIST; fine structure unresolved.