
Chromatography separates mixture components by their interactions with the mobile and stationary phases. Rf compares the distance a spot moves with the solvent front.
Choose from five images below. Open an image for a closer look, download its original PNG, or download all five as a ZIP.
Use these visuals in your lesson
Have students mark the common baseline before calculating each Rf; then discuss what a match with a standard can establish.
A question to discuss
Why does matching Rf support, but not prove, a substance identification?
Chromatography and Rf: five teaching visuals
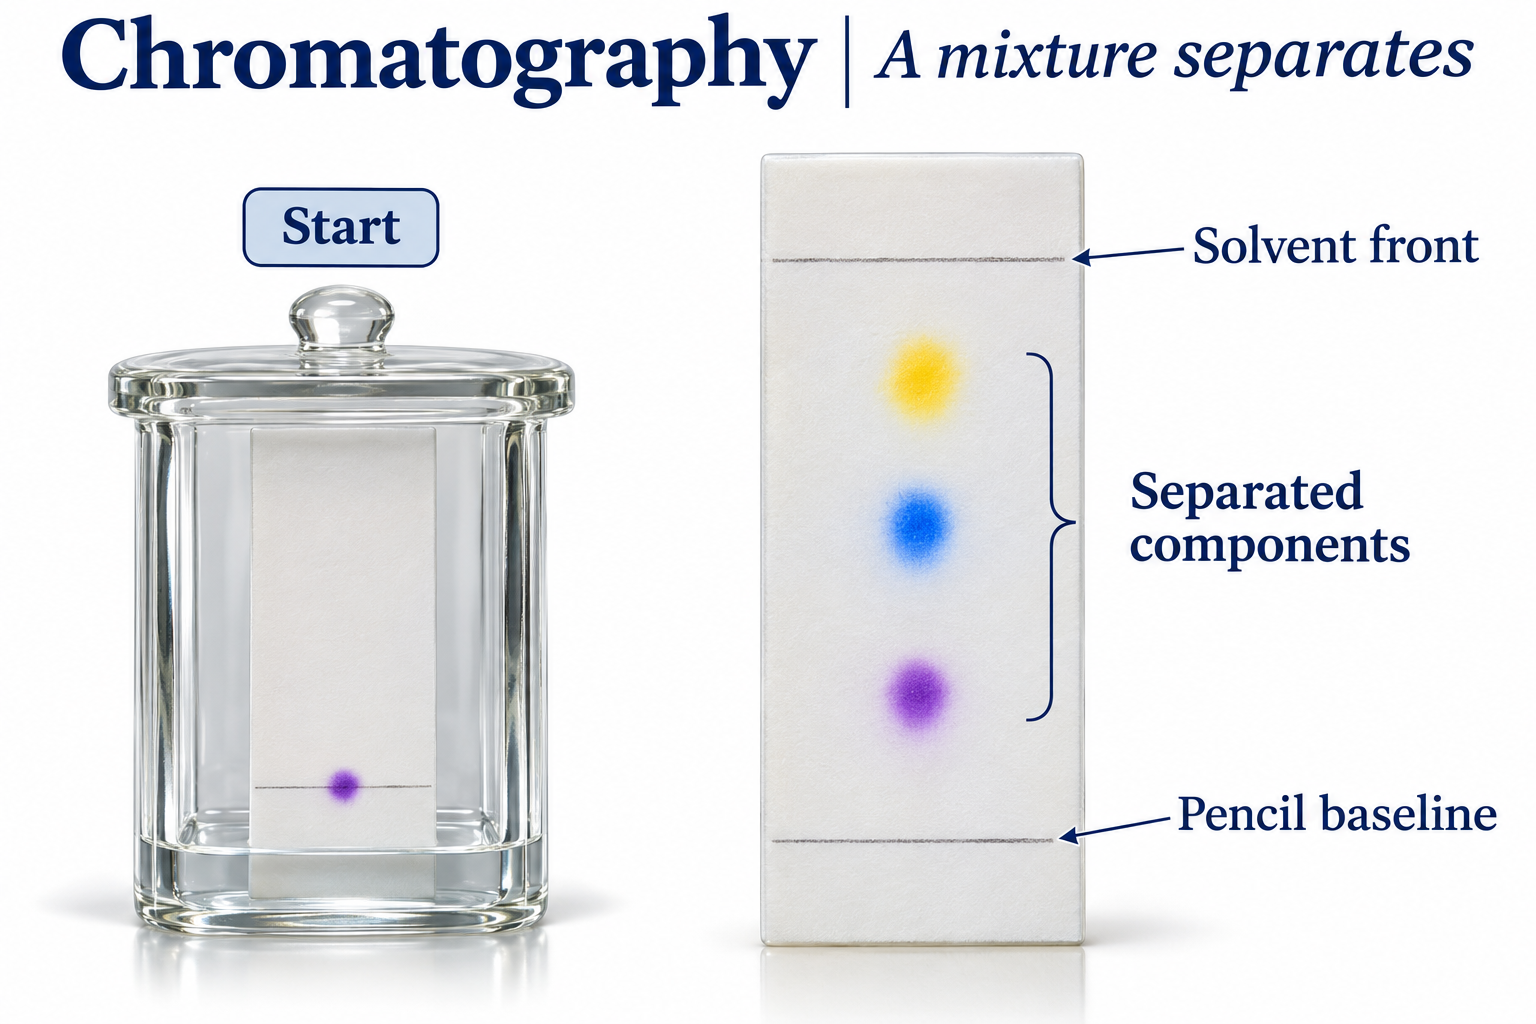
Separating a mixture
Separating a mixture
A developing chamber and separated coloured spots identify the pencil baseline and solvent front.
Download original PNG
Calculating Rf from one baseline
Calculating Rf from one baseline
A spot moves 3.0 cm while solvent moves 6.0 cm, giving Rf = 0.50.
Download original PNG
Mobile and stationary phases
Mobile and stationary phases
A conceptual silica TLC view compares stronger retention at the surface with greater movement in the solvent.
Download original PNG
Comparing a mixture with standards
Comparing a mixture with standards
Spots from a mixture line up with standards A and B under the same developing conditions.
Download original PNG
Two spots, two Rf values
Two spots, two Rf values
An illustrative chromatogram gives blue Rf = 0.25 and yellow Rf = 0.75 from an 8.0 cm solvent front.
Download original PNGAbout these representations
Illustrative chromatography measurements and a conceptual silica adsorption model.