
Distinguish equal forward and reverse rates from equal concentrations at dynamic equilibrium.
Choose from five images below. Open an image for a closer look, download its original PNG, or download all five as a ZIP.
Use these visuals in your lesson
Compare the concentration and rate graphs together, then predict what happens when more reactant is added.
A question to discuss
Why can concentrations remain constant while both reactions continue?
Dynamic equilibrium: five teaching visuals
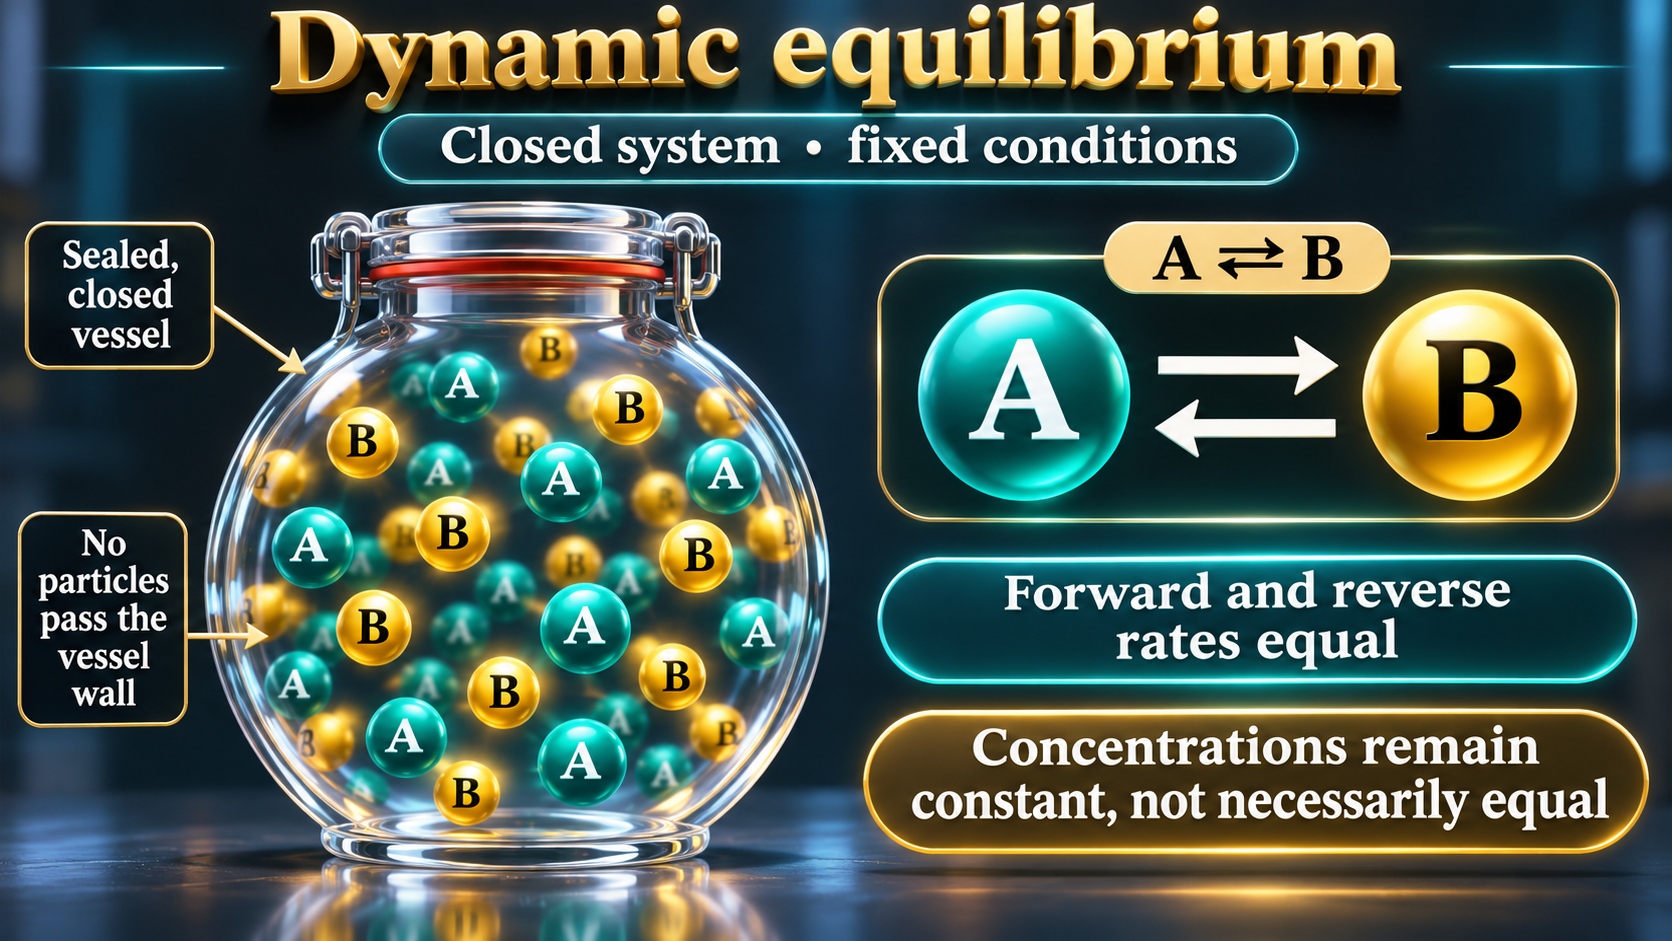
Teaching illustration
A closed system
A sealed-vessel model shows continuing forward and reverse reactions with constant, not necessarily equal, concentrations.
Download original PNG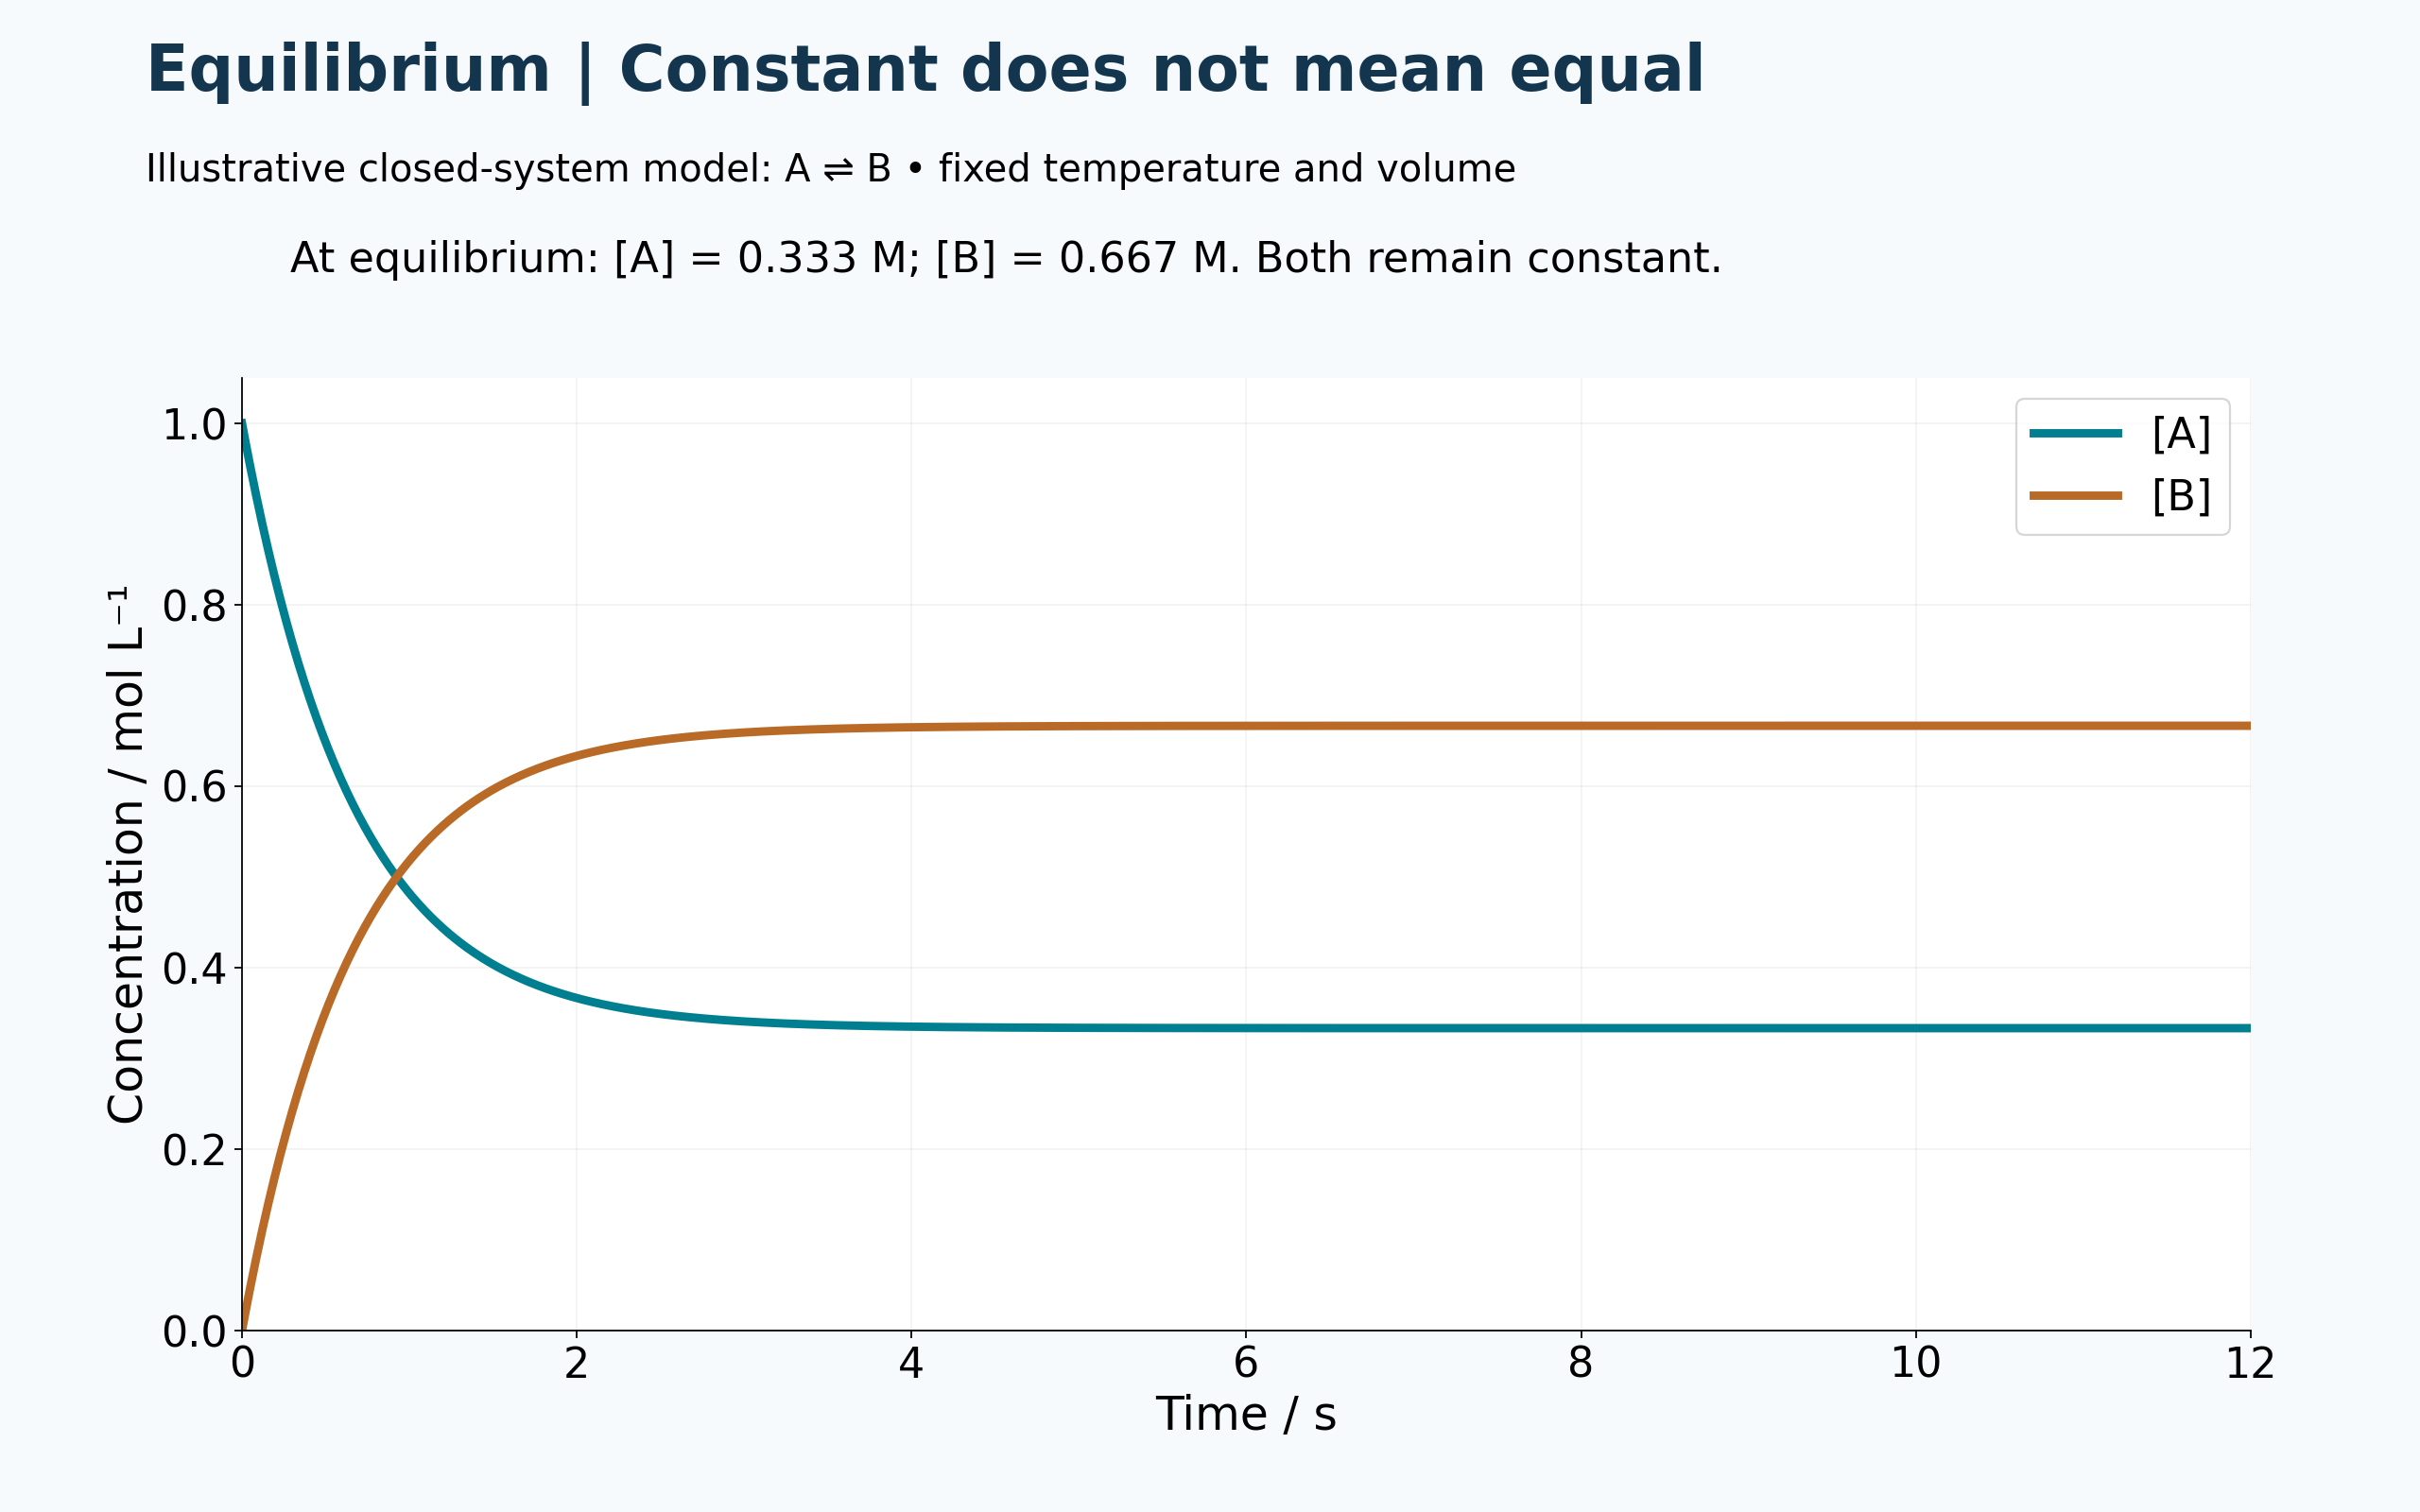
Calculated teaching model
Constant does not mean equal
An illustrative A ⇌ B model reaches unequal but constant concentrations.
Download original PNG
Calculated teaching model
Equal rates
Forward and reverse rates approach the same nonzero value in the model system.
Download original PNG
Calculated teaching model
After a disturbance
Adding A produces a new equilibrium while the model equilibrium concentration ratio returns to two.
Download original PNG
Teaching illustration
Pressure and temperature
An ammonia-equilibrium comparison separates the effects of compression and temperature on equilibrium and rate.
Download original PNGAbout these representations
Graphs are illustrative closed-system kinetic models at fixed temperature and volume, not measured reaction data. The final panel uses the exothermic ammonia equilibrium.