
Connect the regions of a heating curve with warming and changes of state.
Choose from five images below. Open an image for a closer look, download its original PNG, or download all five as a ZIP.
Use these visuals in your lesson
Ask students where energy changes temperature and where it changes phase, then compare heating with cooling.
A question to discuss
Why can a pure substance absorb heat while its temperature remains constant?
Heating curve and changes of state: five teaching visuals

Qualitative diagram
Heating a pure substance
An idealised curve shows warming separated by melting and boiling plateaus.
Download original PNG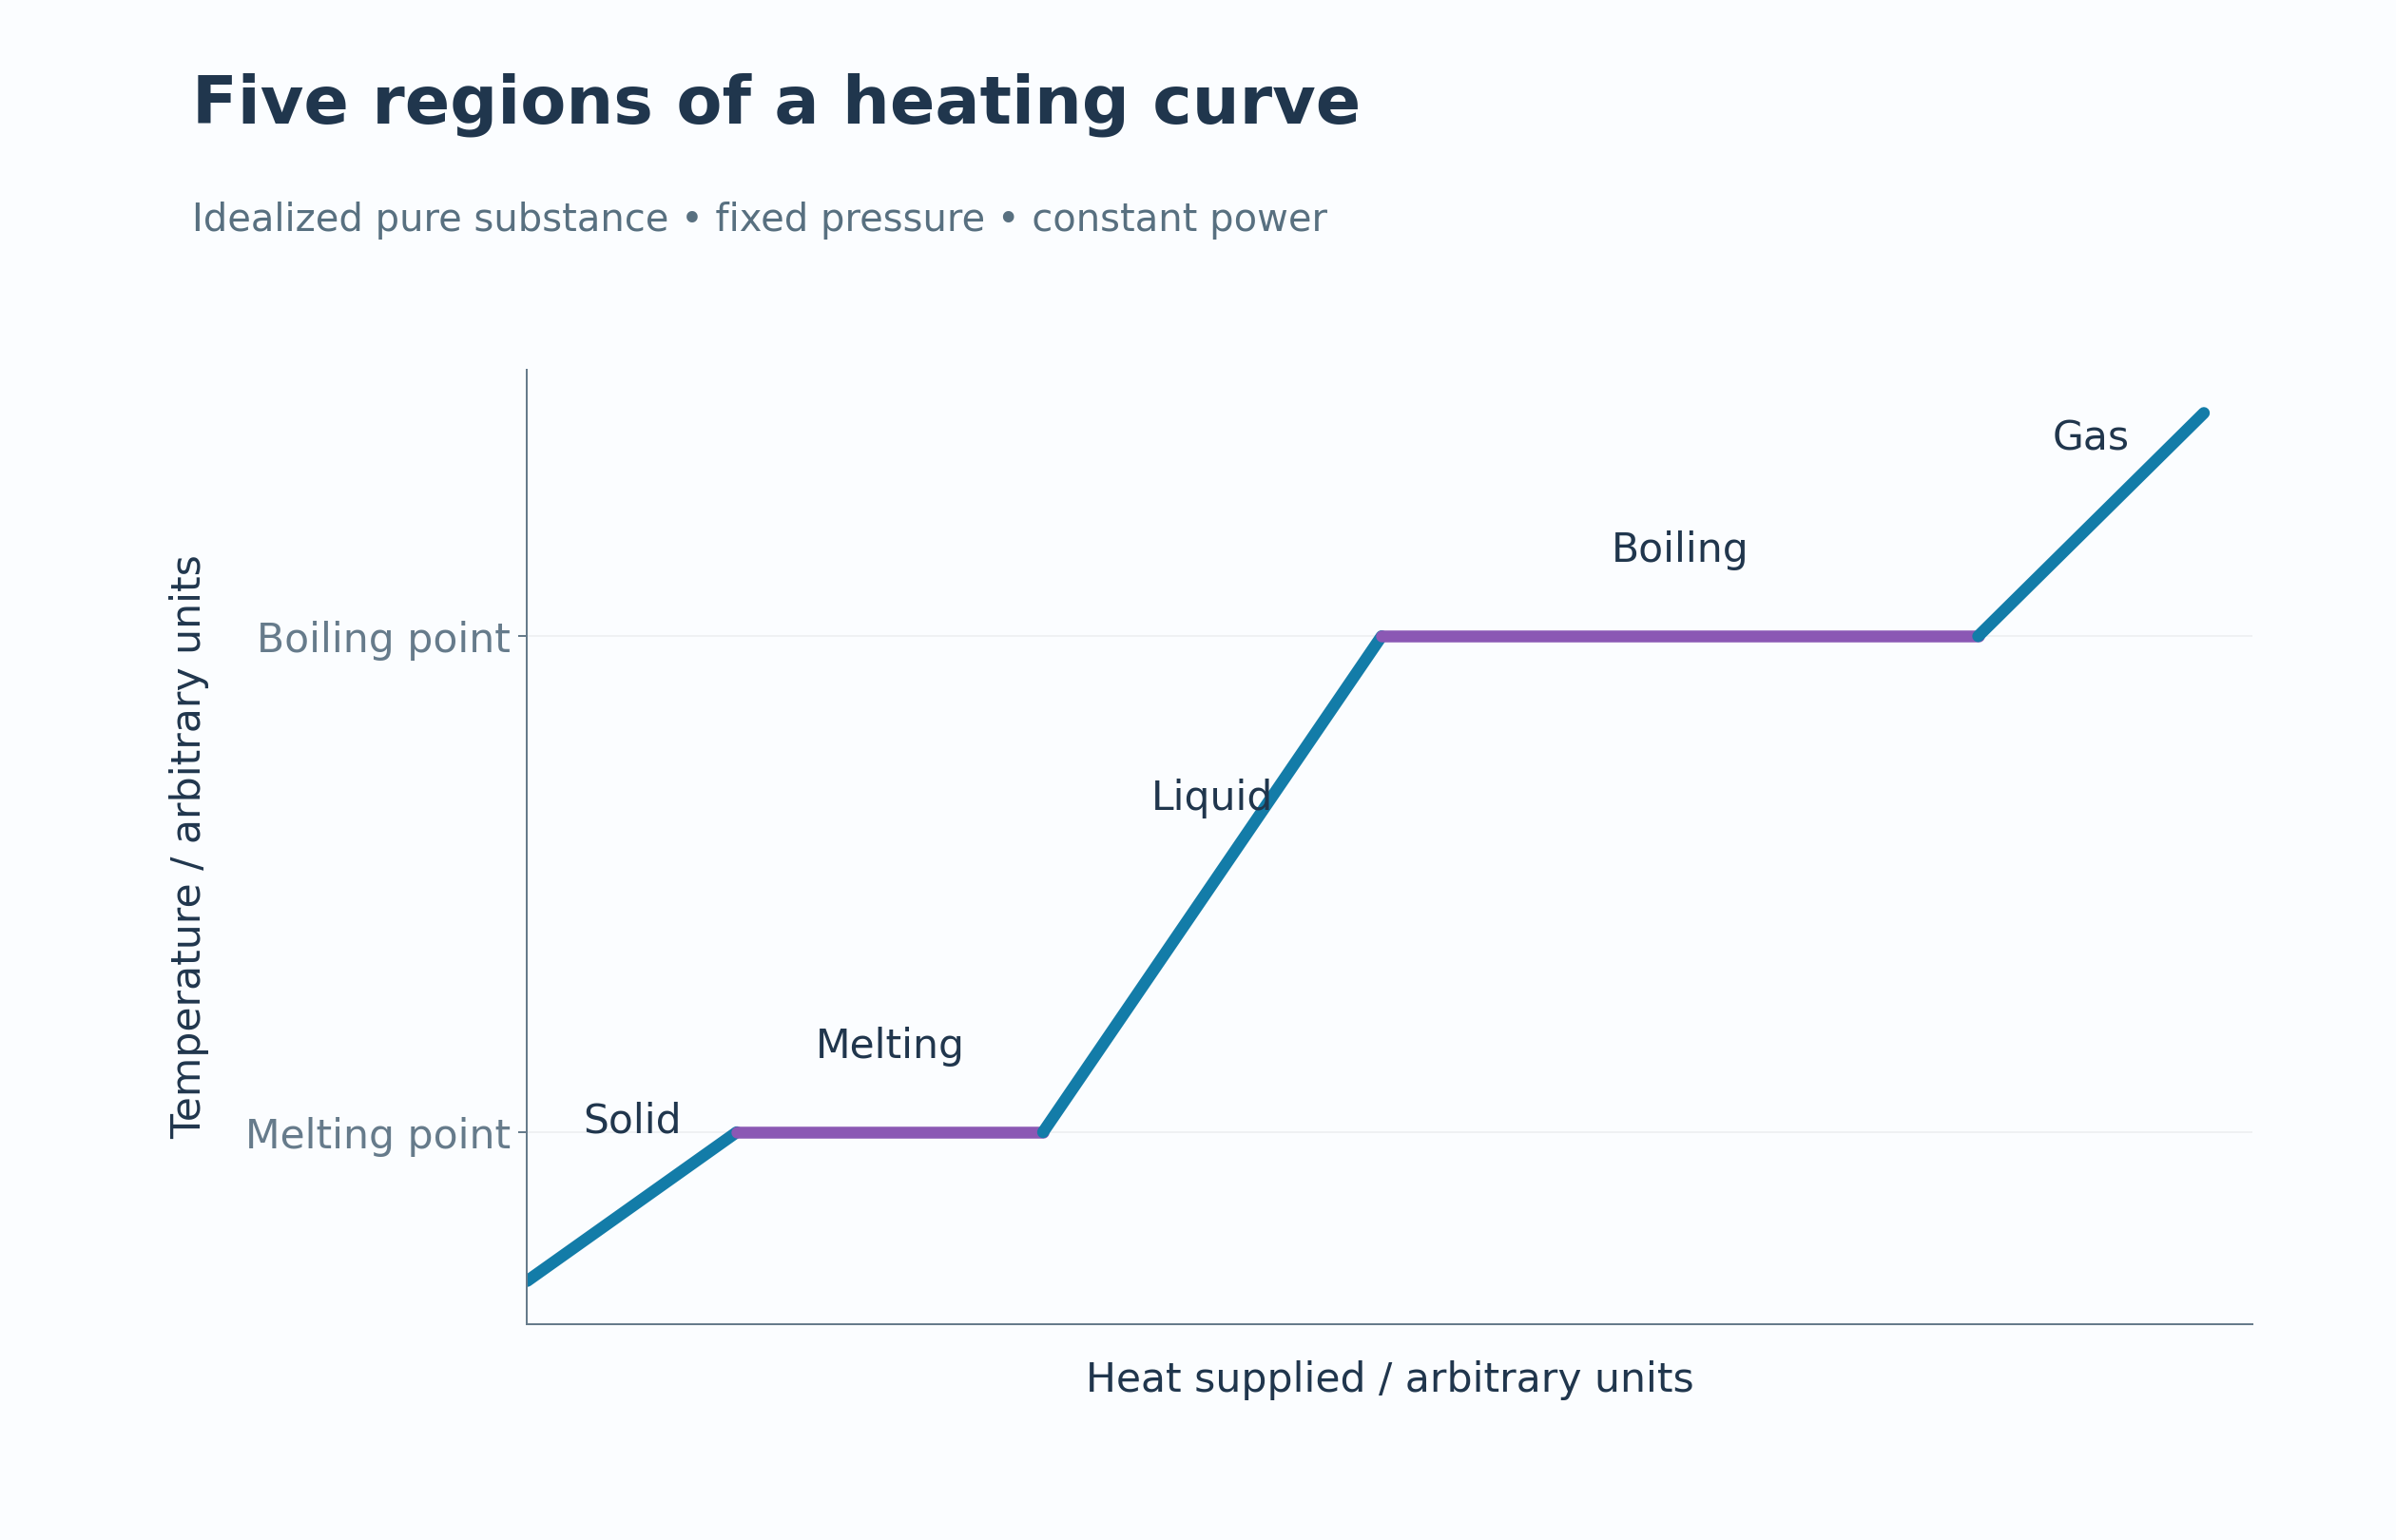
Qualitative diagram
Five regions
Labels identify solid warming, melting, liquid warming, boiling and gas warming.
Download original PNG
Qualitative diagram
Where the energy goes
Slopes use q = mcΔT while phase-change plateaus use q = mL.
Download original PNG
Qualitative diagram
Particles across phases
Symbolic particle arrangements accompany the solid, liquid and gas regions.
Download original PNG
Qualitative diagram
Heating and cooling
Opposing curves compare heating and cooling with equal power magnitudes.
Download original PNGAbout these representations
Idealised pure-substance curves at fixed pressure and constant power, using arbitrary units. Particle diagrams are symbolic arrangements.