
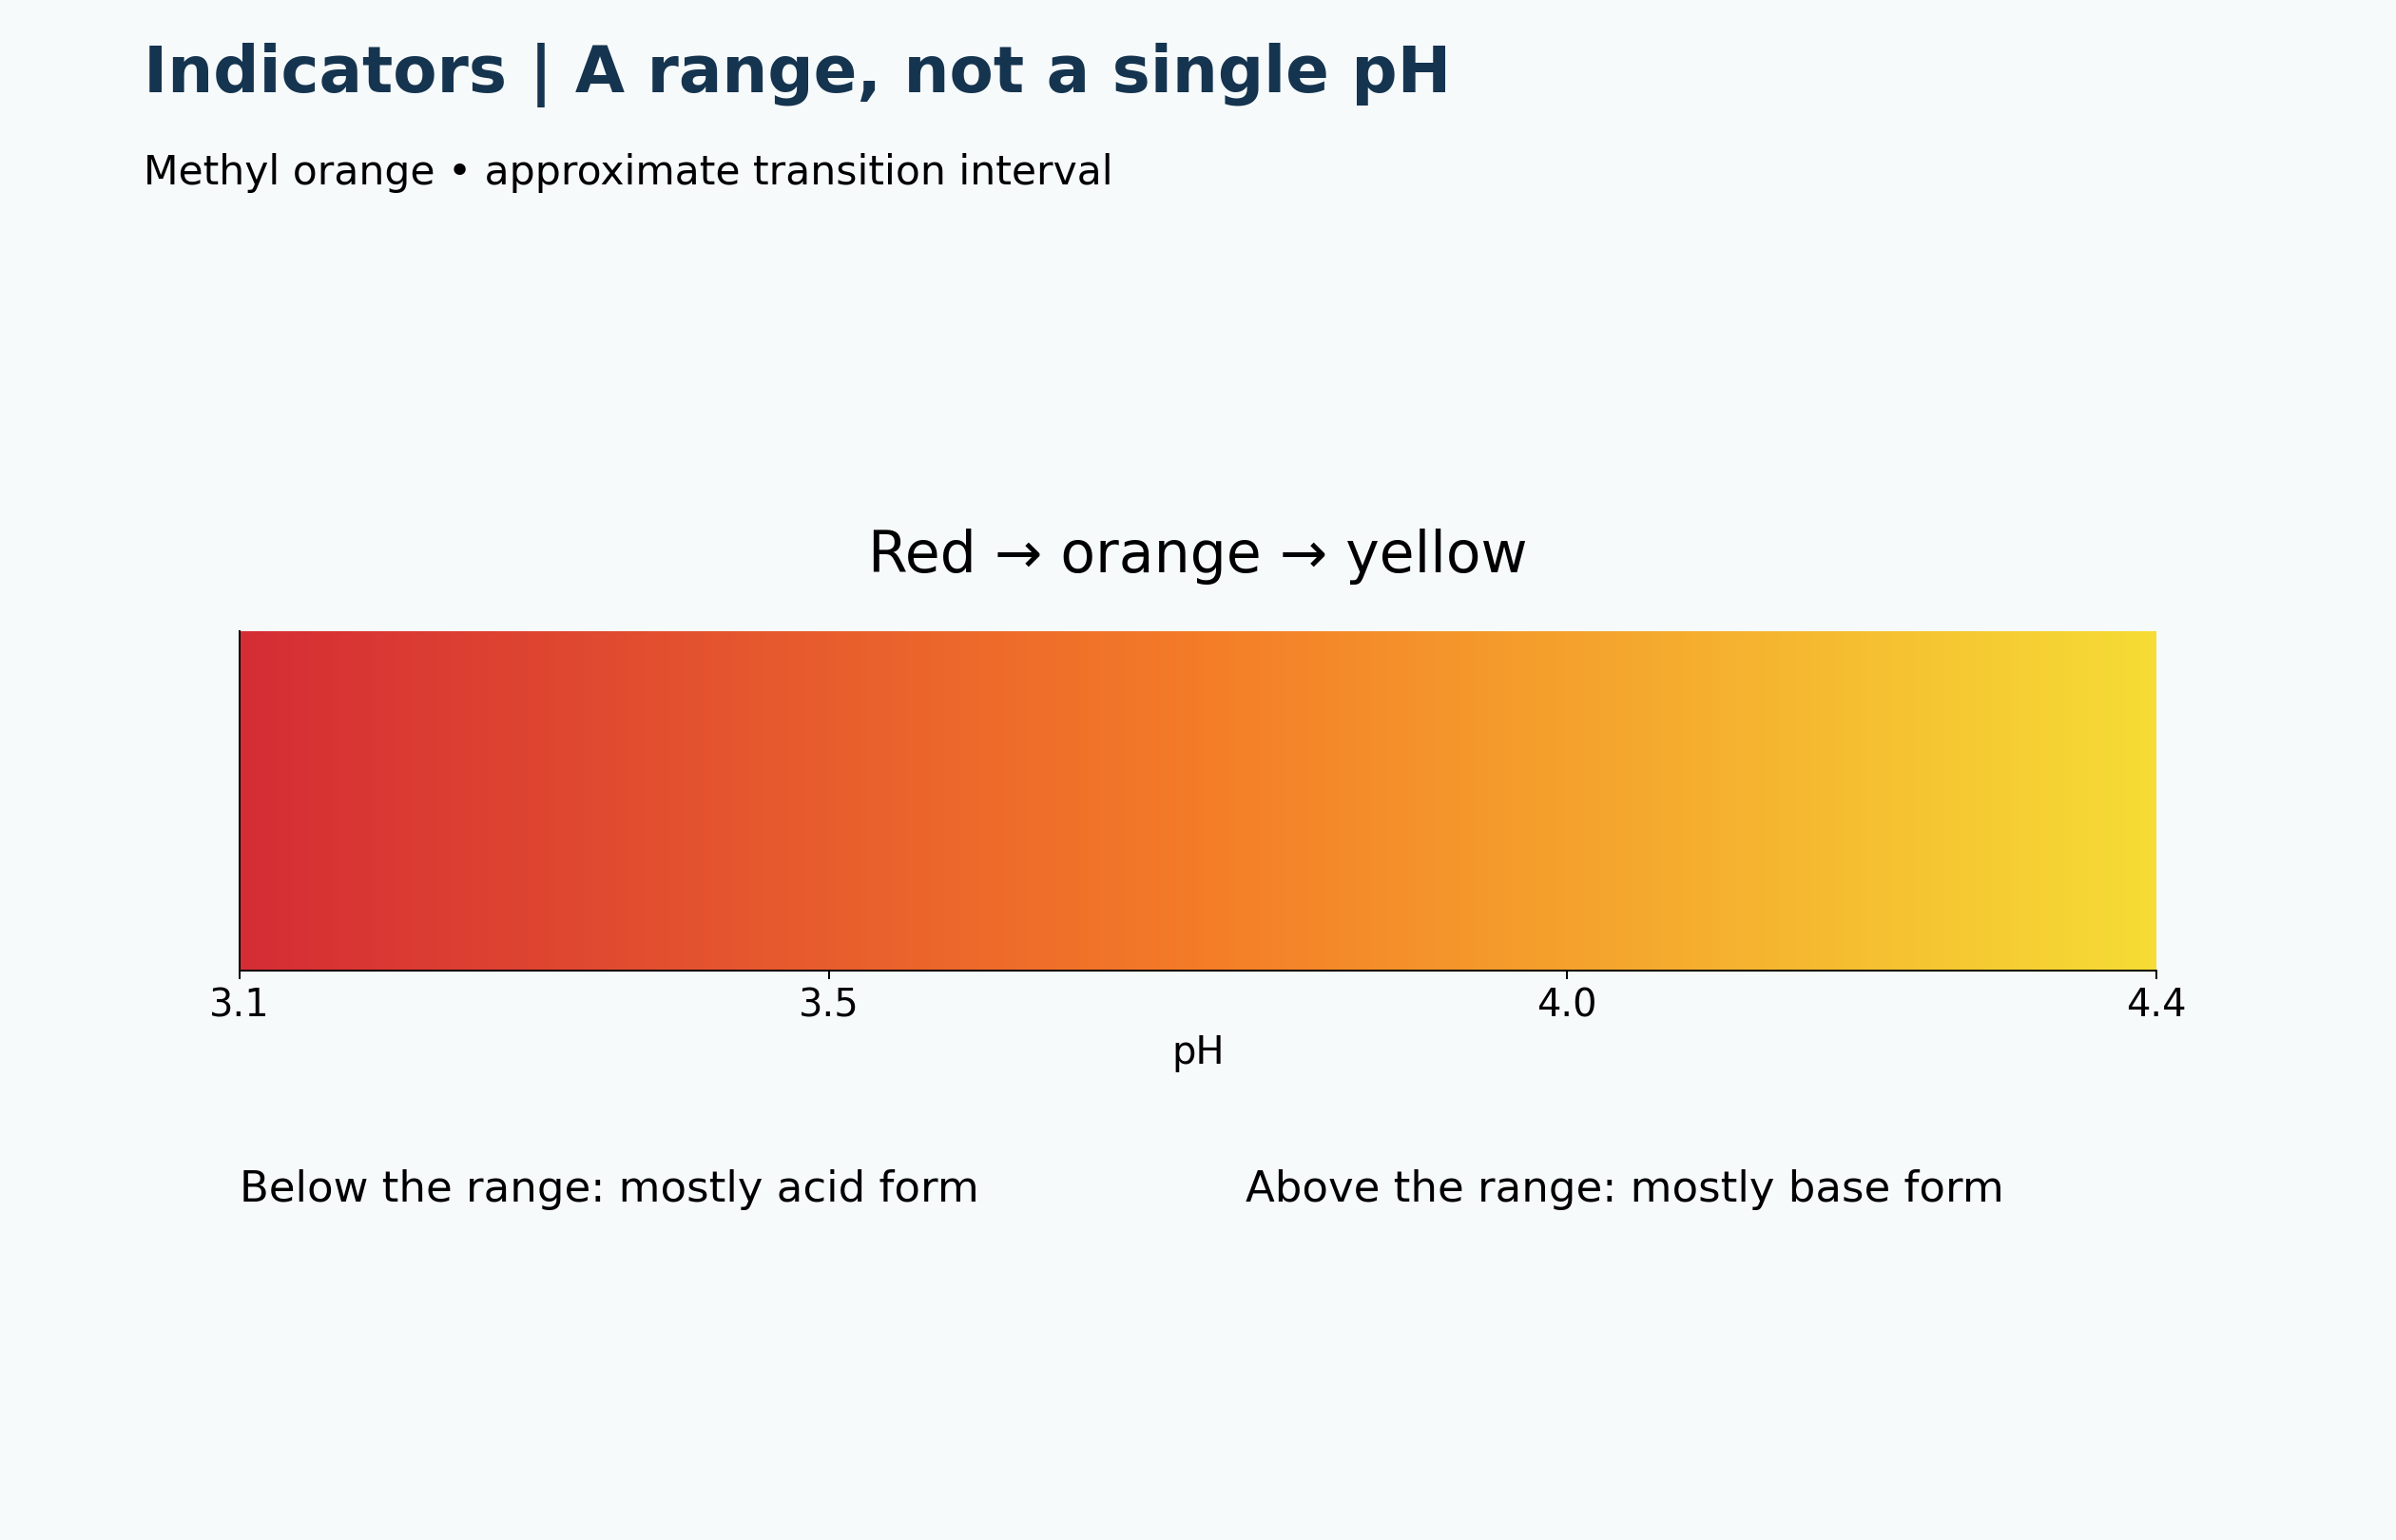
An indicator changes colour over a pH range, not at one exact value. A suitable range lies within the steep part of the titration curve.
Choose from five images below. Open an image for a closer look, download its original PNG, or download all five as a ZIP.
Use these visuals in your lesson
Compare phenolphthalein and methyl orange for the illustrated ethanoic-acid titration. Distinguish observed endpoint from equivalence.
A question to discuss
Why is methyl orange unsuitable for the weak-acid titration shown?
Choosing a titration indicator: five teaching visuals
An indicator transition range
An indicator transition range
Methyl orange changes from red through orange to yellow over an approximate pH range 3.1–4.4.
Download original PNG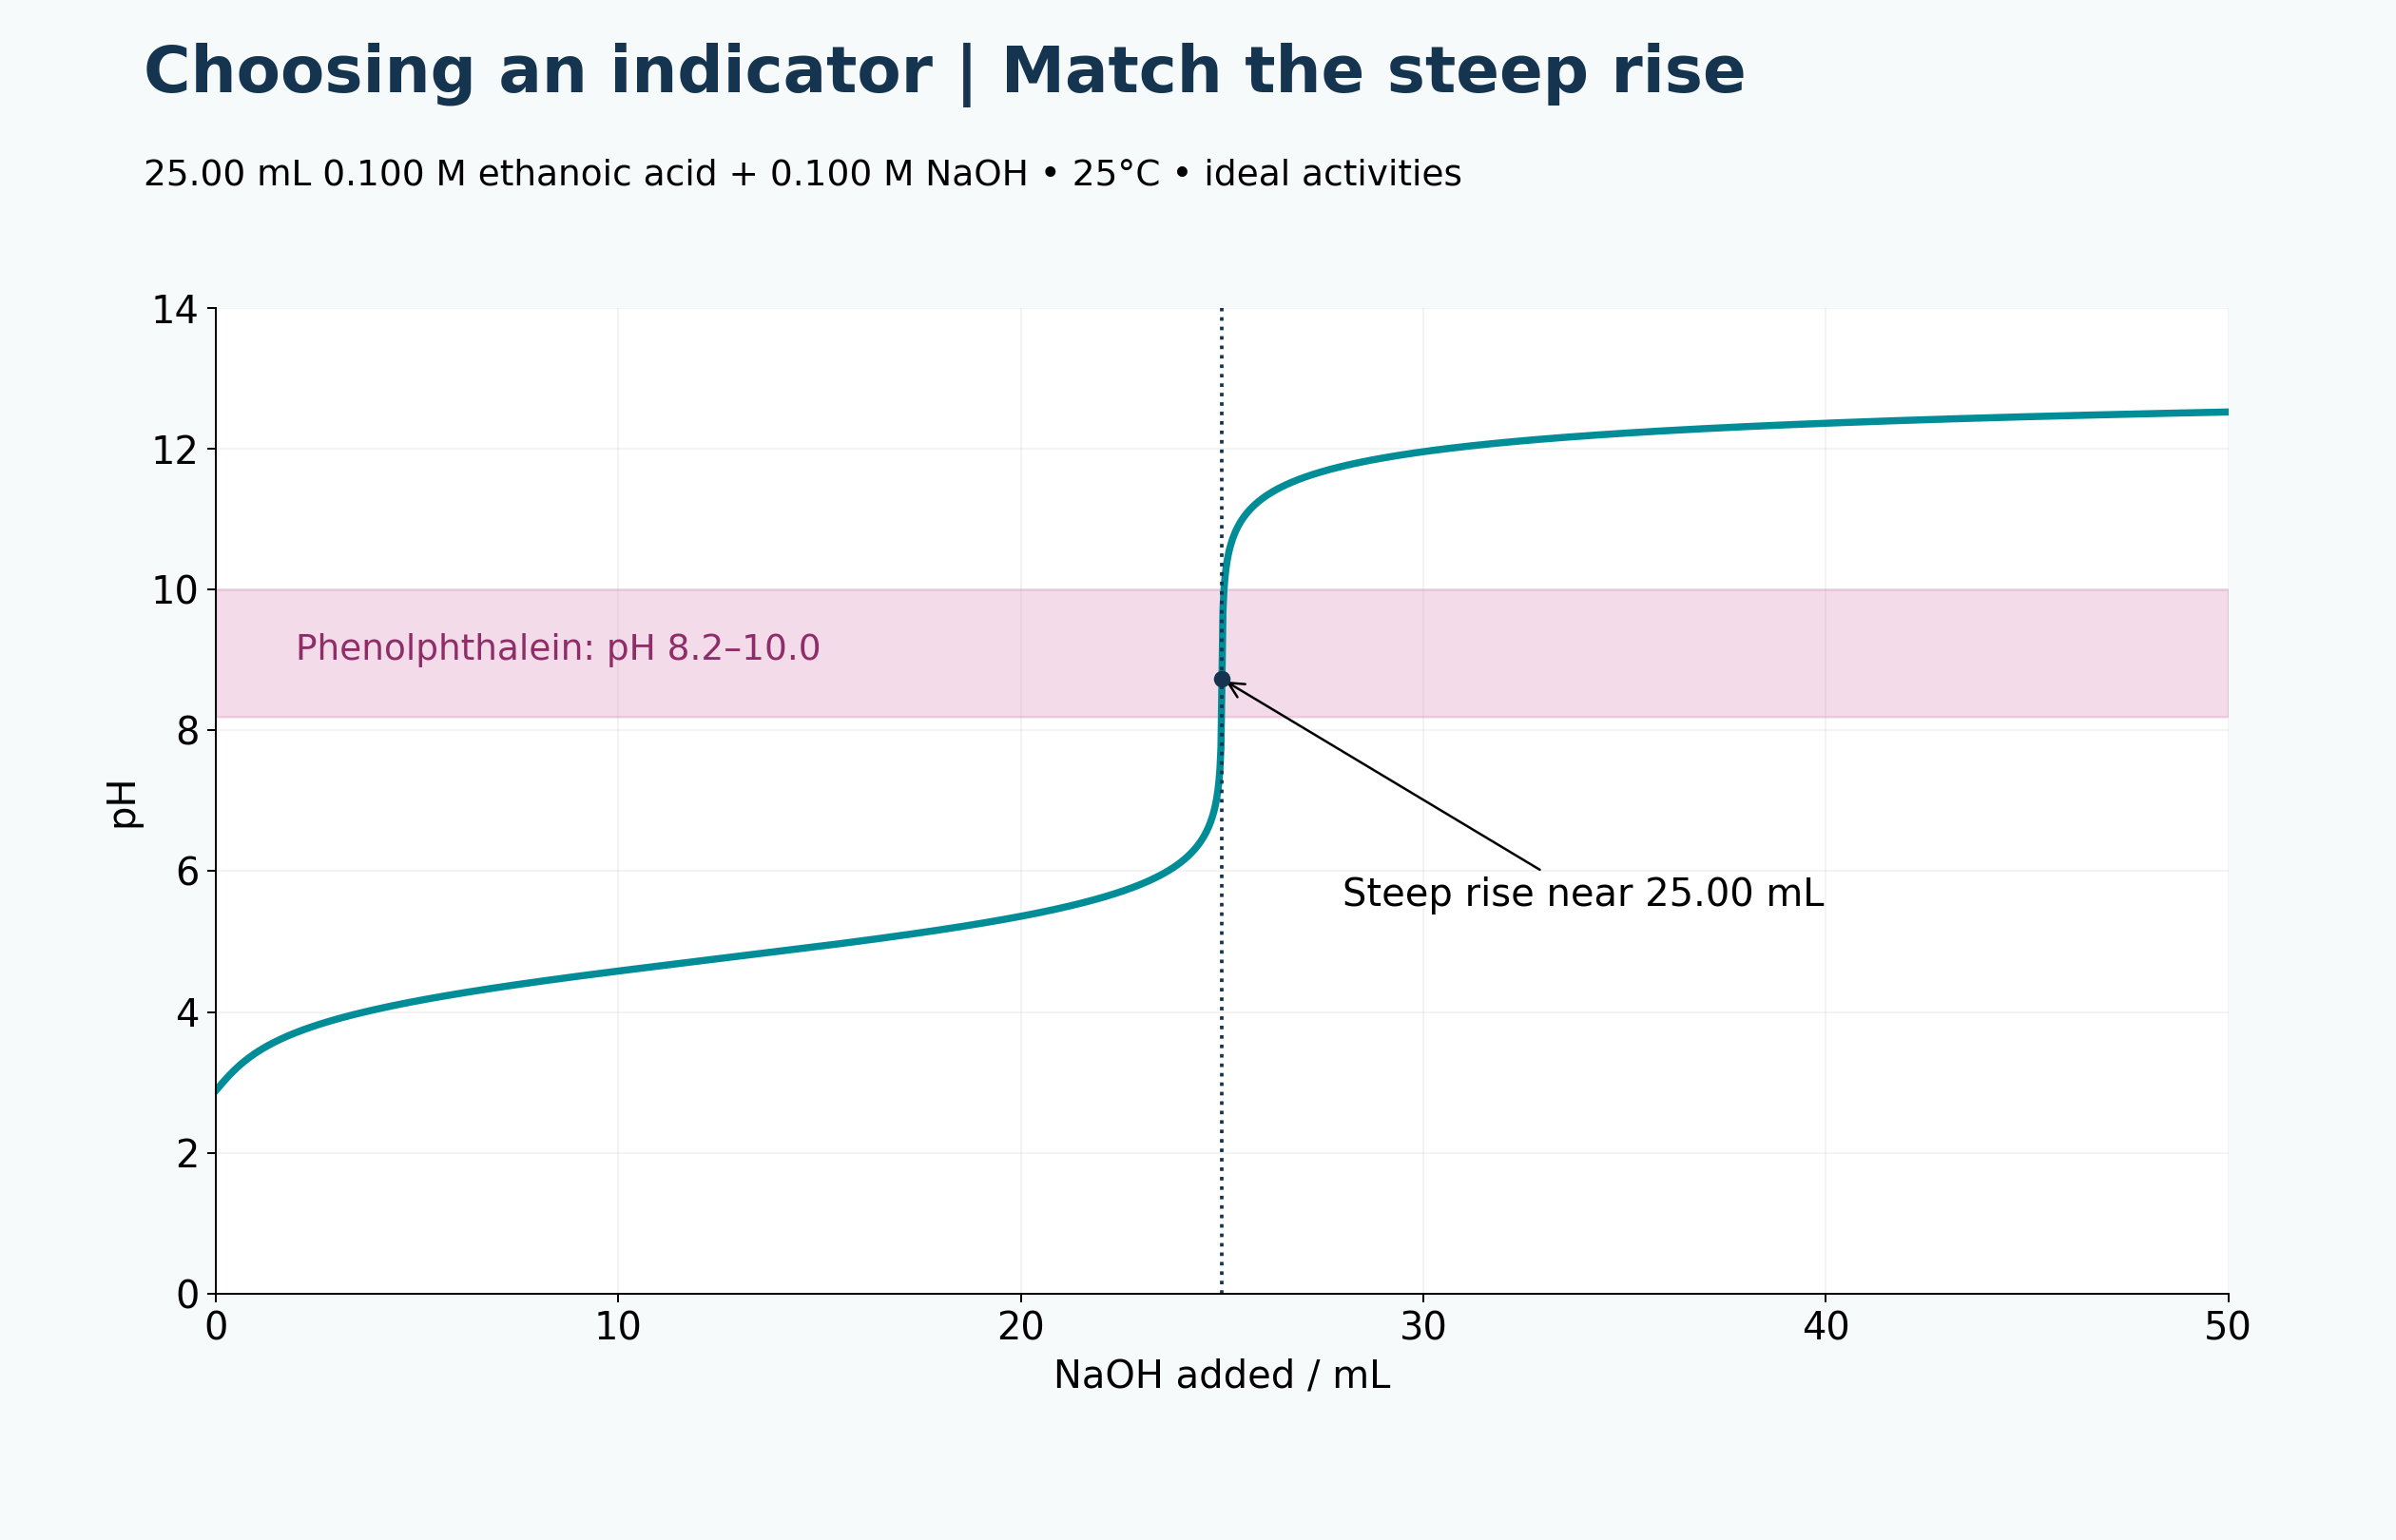
Matching the steep rise
Matching the steep rise
A calculated ethanoic acid–NaOH curve places the phenolphthalein interval around the steep rise near 25.00 mL.
Download original PNG
Two coloured indicator forms
Two coloured indicator forms
A generic HIn equilibrium and concentration-ratio equation connect pH with acid-form and base-form colour.
Download original PNG
Comparing two indicators
Comparing two indicators
Phenolphthalein overlaps the steep rise of a weak-acid titration; methyl orange changes colour too early.
Download original PNG
Endpoint is not equivalence
Endpoint is not equivalence
The curve distinguishes observed colour change from stoichiometric equivalence at approximately pH 8.73.
Download original PNGAbout these representations
Calculated ideal-activity ethanoic acid titration at 25 °C, Ka = 1.75×10⁻⁵ and Kw = 1×10⁻¹⁴; not measured titration data.