
Explain first-ionisation-energy patterns and their exceptions using electron configurations.
Choose from five images below. Open an image for a closer look, download its original PNG, or download all five as a ZIP.
Use these visuals in your lesson
Use the Period 3 graph to make a prediction, then explain the magnesium–aluminium and phosphorus–sulfur dips.
A question to discuss
Why does aluminium have a lower first ionisation energy than magnesium?
First ionization energy trends: five teaching visuals
Teaching illustration
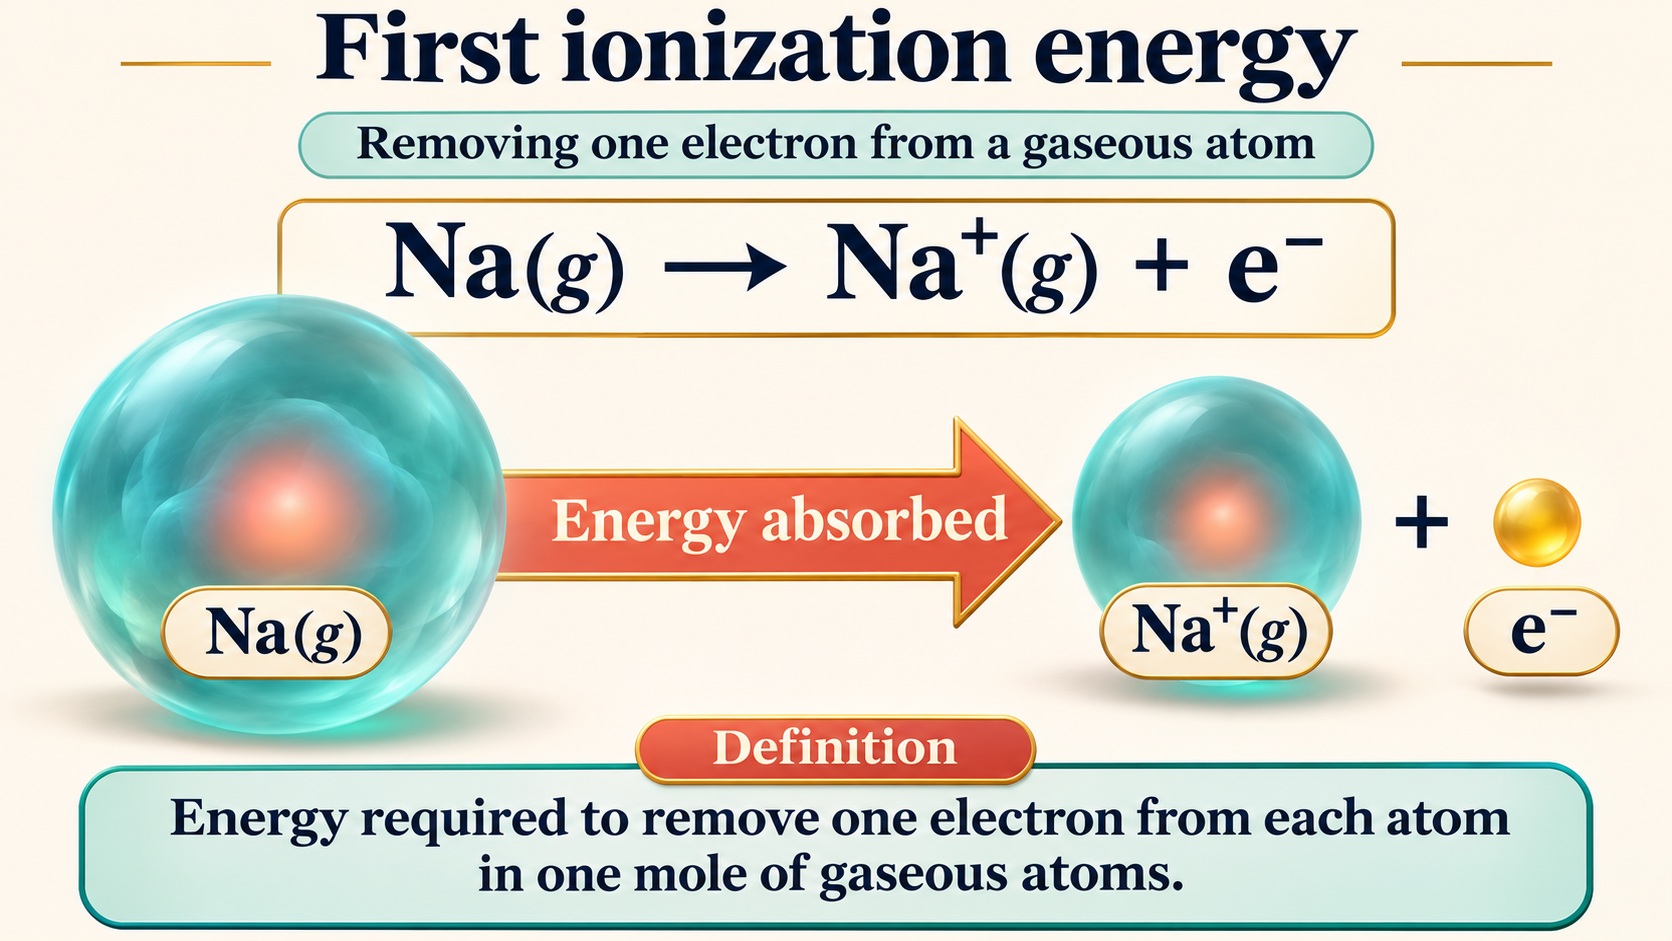
Removing a gaseous electron
A sodium example defines first ionisation energy and shows energy absorption.
Download original PNG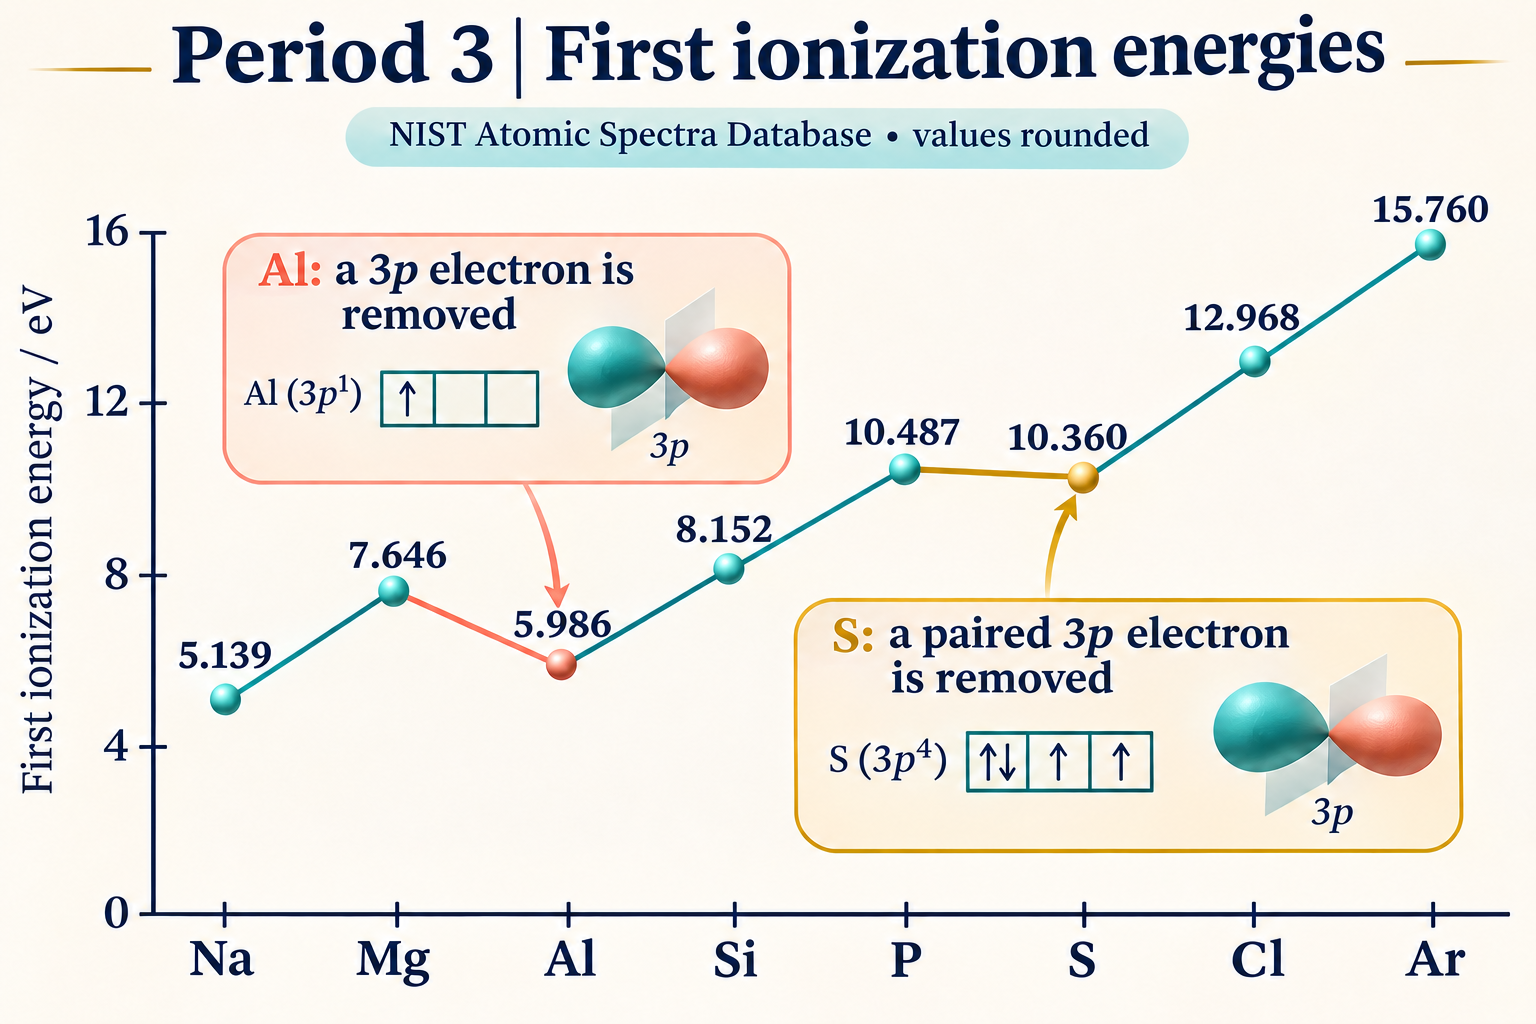
Data-based teaching diagram
Period 3 energies
A graph of rounded NIST values shows the Period 3 trend and the aluminium and sulfur dips.
Download original PNG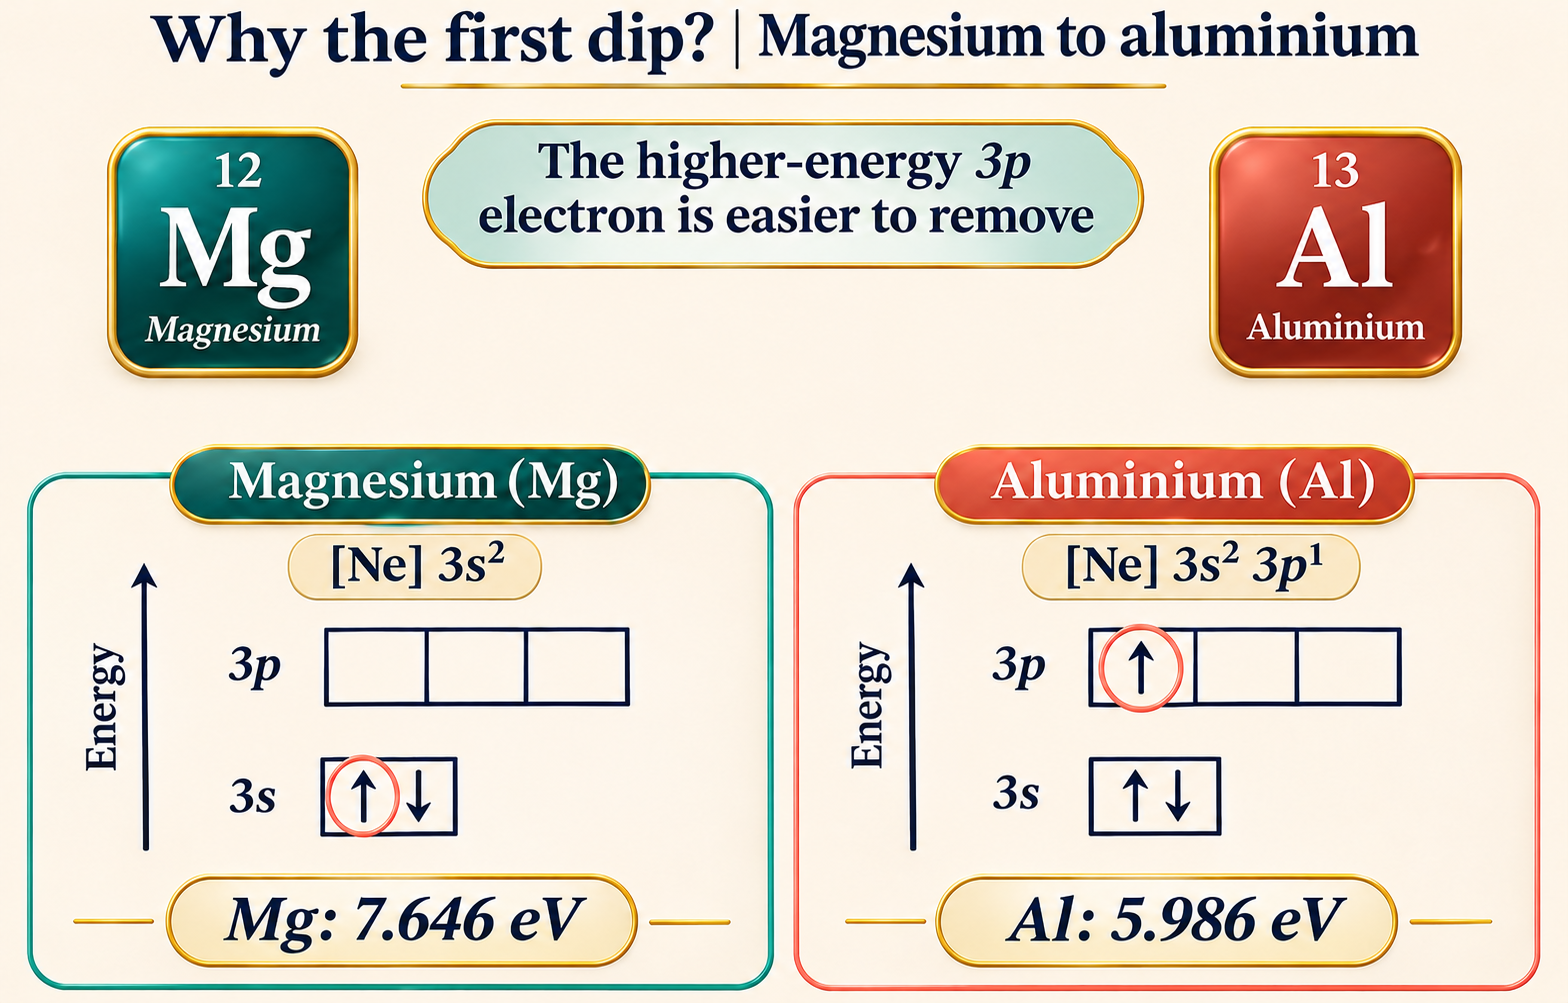
Data-based teaching diagram
Magnesium to aluminium
Orbital boxes show that aluminium loses a higher-energy 3p electron rather than a 3s electron.
Download original PNG
Data-based teaching diagram
Phosphorus to sulfur
Paired-electron repulsion helps explain sulfur’s slightly lower first ionisation energy.
Download original PNG
Data-based teaching diagram
A jump after two electrons
Successive magnesium ionisation energies show the large increase on removing an inner-shell electron.
Download original PNGAbout these representations
Ionisation-energy values shown are rounded NIST Atomic Spectra Database values; atom and orbital artwork is explanatory.