
Interpret chlorine isotope peaks and calculate approximate atomic and molecular isotope patterns.
Choose from five images below. Open an image for a closer look, download its original PNG, or download all five as a ZIP.
Use these visuals in your lesson
Read both axes before calculating a weighted mean; use isotope combinations to predict molecular-ion peaks.
A question to discuss
Why does chlorine’s relative atomic mass not mean that some atoms have a mass number of 35.5?
Reading an isotope mass spectrum: five teaching visuals
Teaching illustration
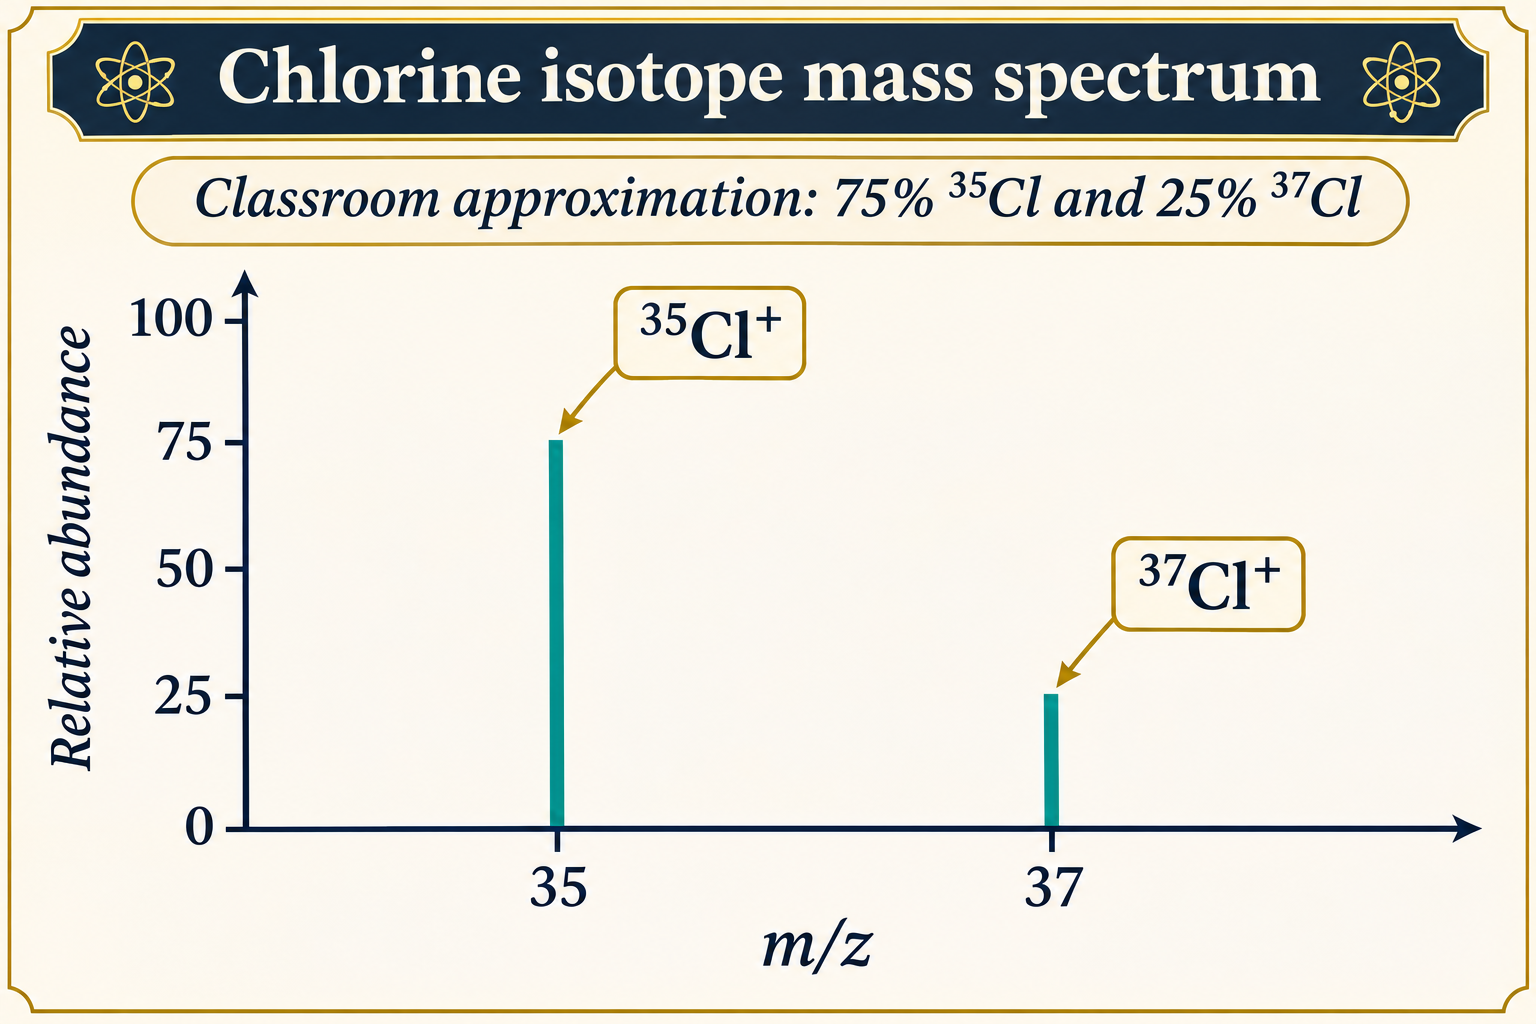
Chlorine isotope peaks
An illustrative chlorine-ion spectrum uses approximate 75% chlorine-35 and 25% chlorine-37 abundances.
Download original PNG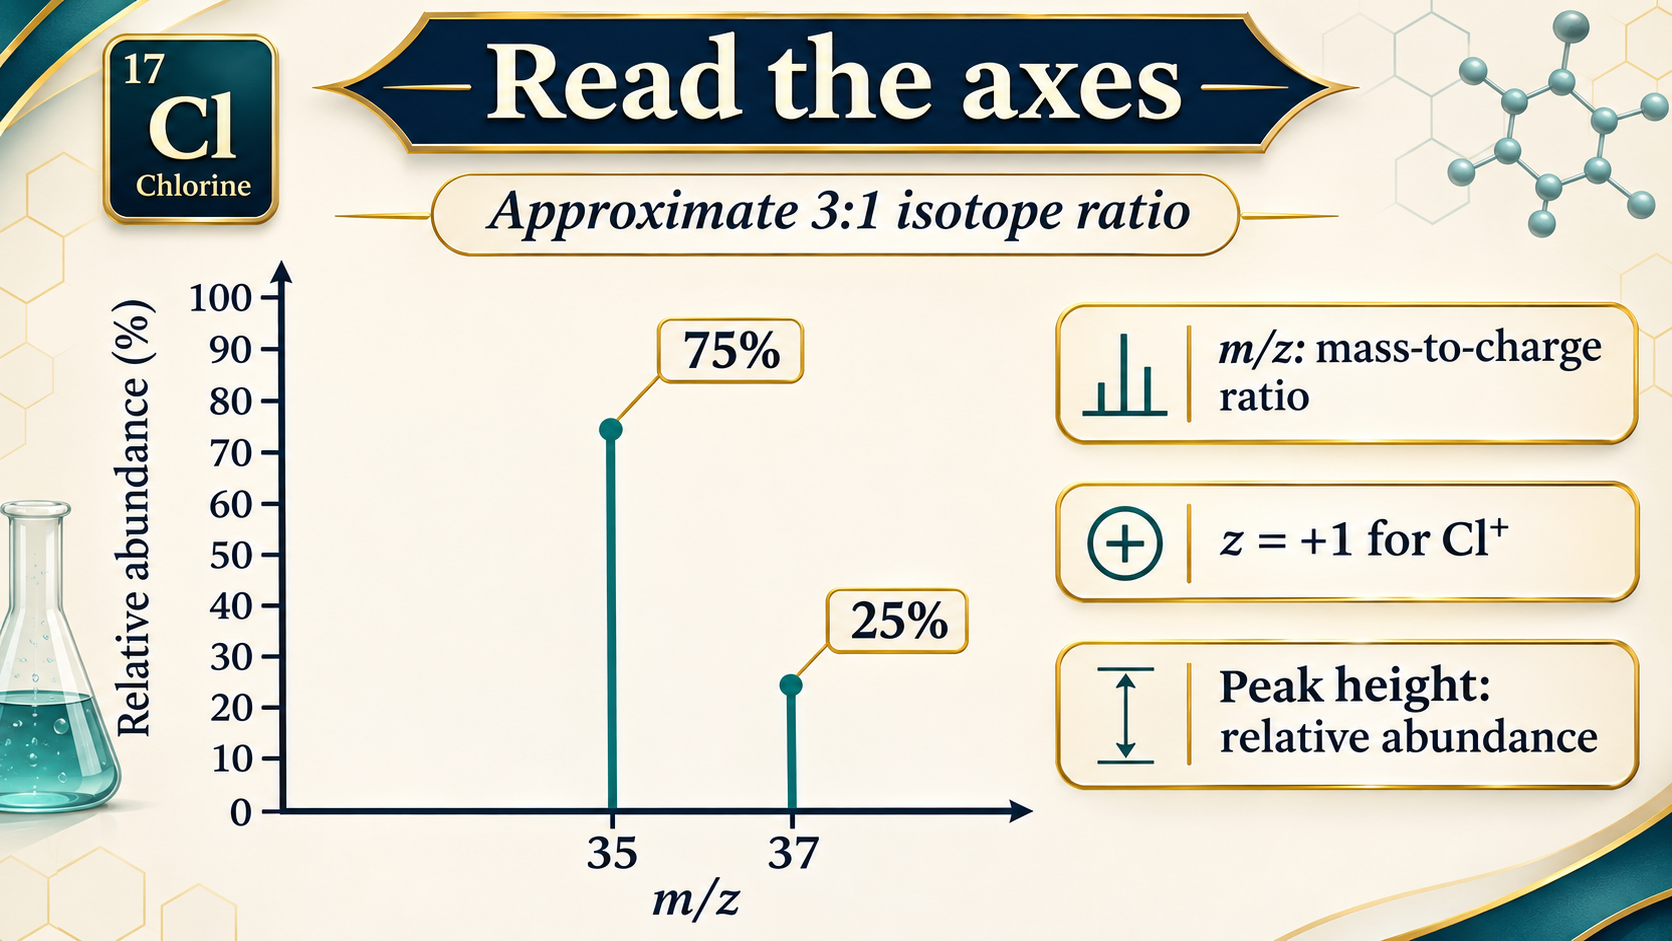
Teaching illustration
Read the axes
Labels explain mass-to-charge ratio and relative abundance for singly charged chlorine ions.
Download original PNG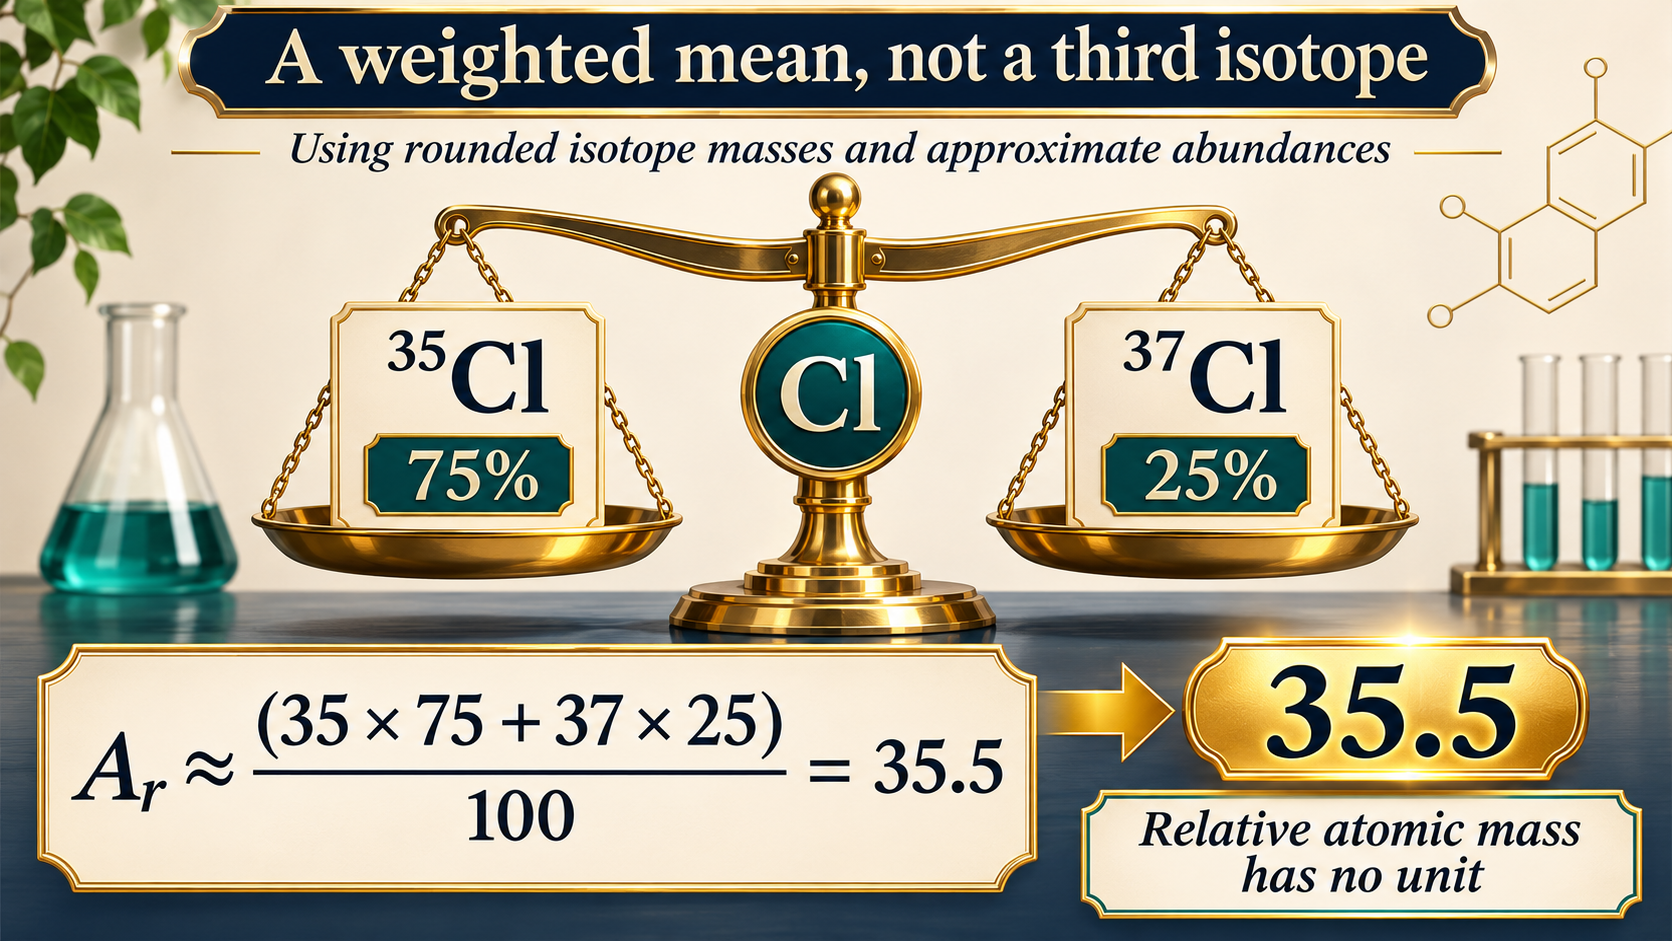
Teaching illustration
A weighted mean
A classroom calculation uses rounded masses and abundances to obtain relative atomic mass about 35.5.
Download original PNG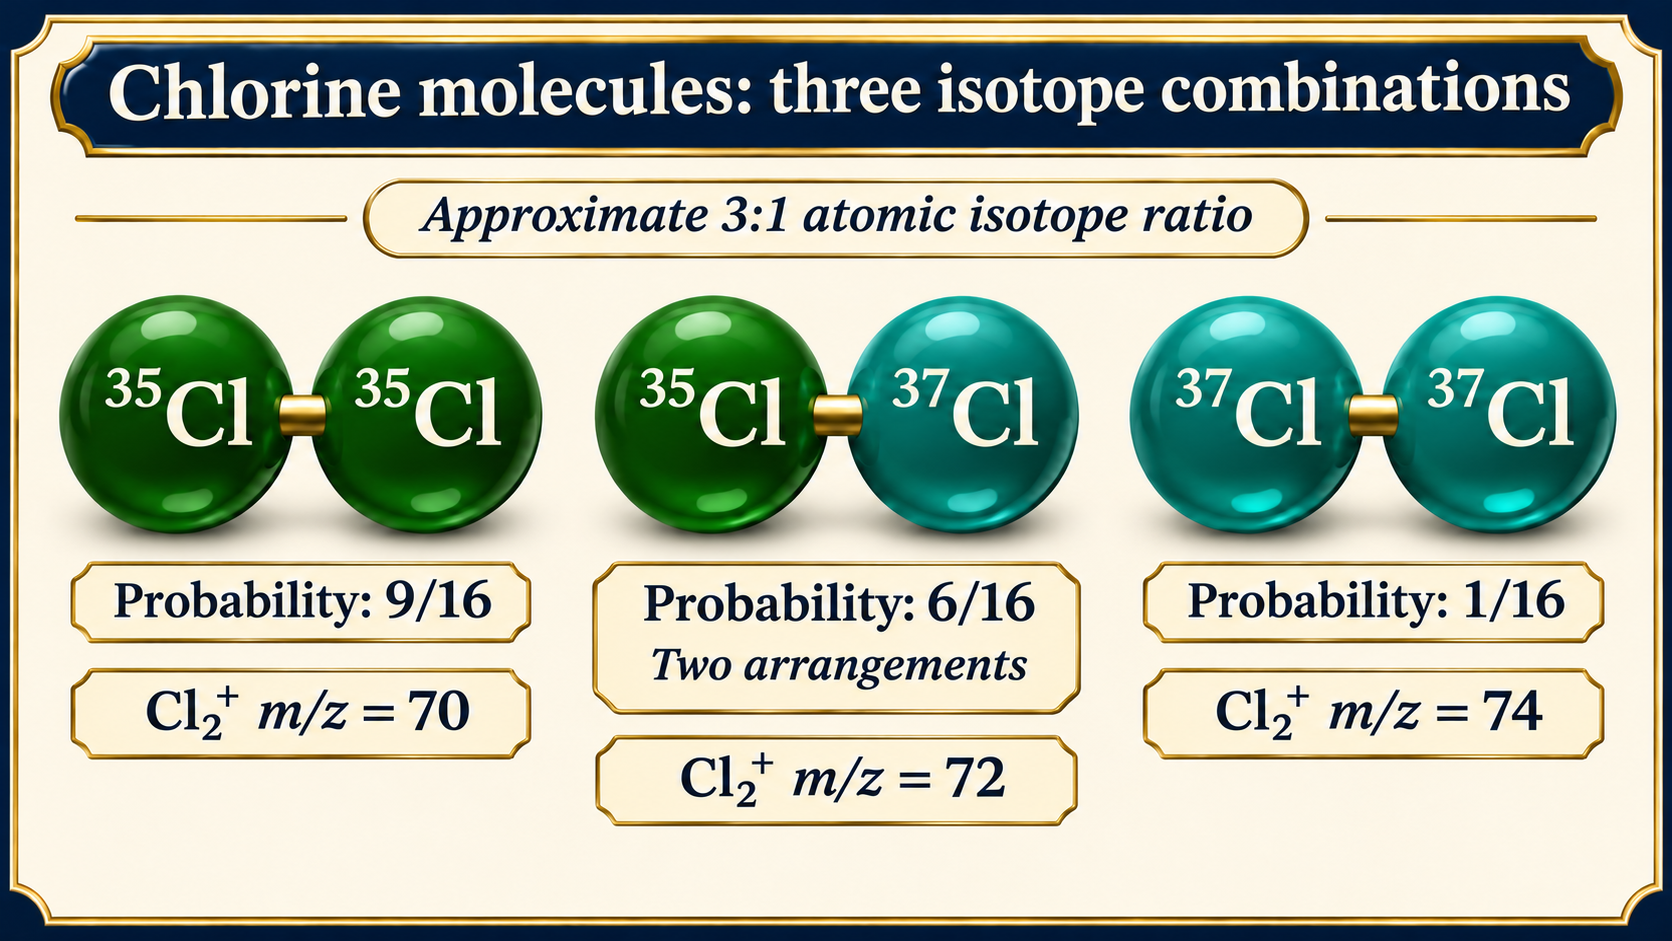
Teaching illustration
Three isotope combinations
Chlorine molecules give approximate probabilities 9/16, 6/16 and 1/16 for the three mass combinations.
Download original PNG
Teaching illustration
Atomic versus molecular ions
Predicted Cl+ and Cl2+ isotope patterns compare approximate 3:1 and 9:6:1 intensity ratios.
Download original PNGAbout these representations
Illustrative isotope spectra use a classroom 3:1 chlorine isotope ratio and rounded isotope masses, not exact natural abundances or experimental spectra.