
Explore how temperature changes a molecular-energy distribution and the fraction above a chosen threshold.
Choose from five images below. Open an image for a closer look, download its original PNG, or download all five as a ZIP.
Use these visuals in your lesson
Compare total areas before comparing the high-energy tails; separate heating from lowering a reaction barrier.
A question to discuss
How can the peak become lower while the fraction above a fixed energy threshold increases?
Temperature and the Maxwell–Boltzmann distribution: five teaching visuals
Calculated teaching model
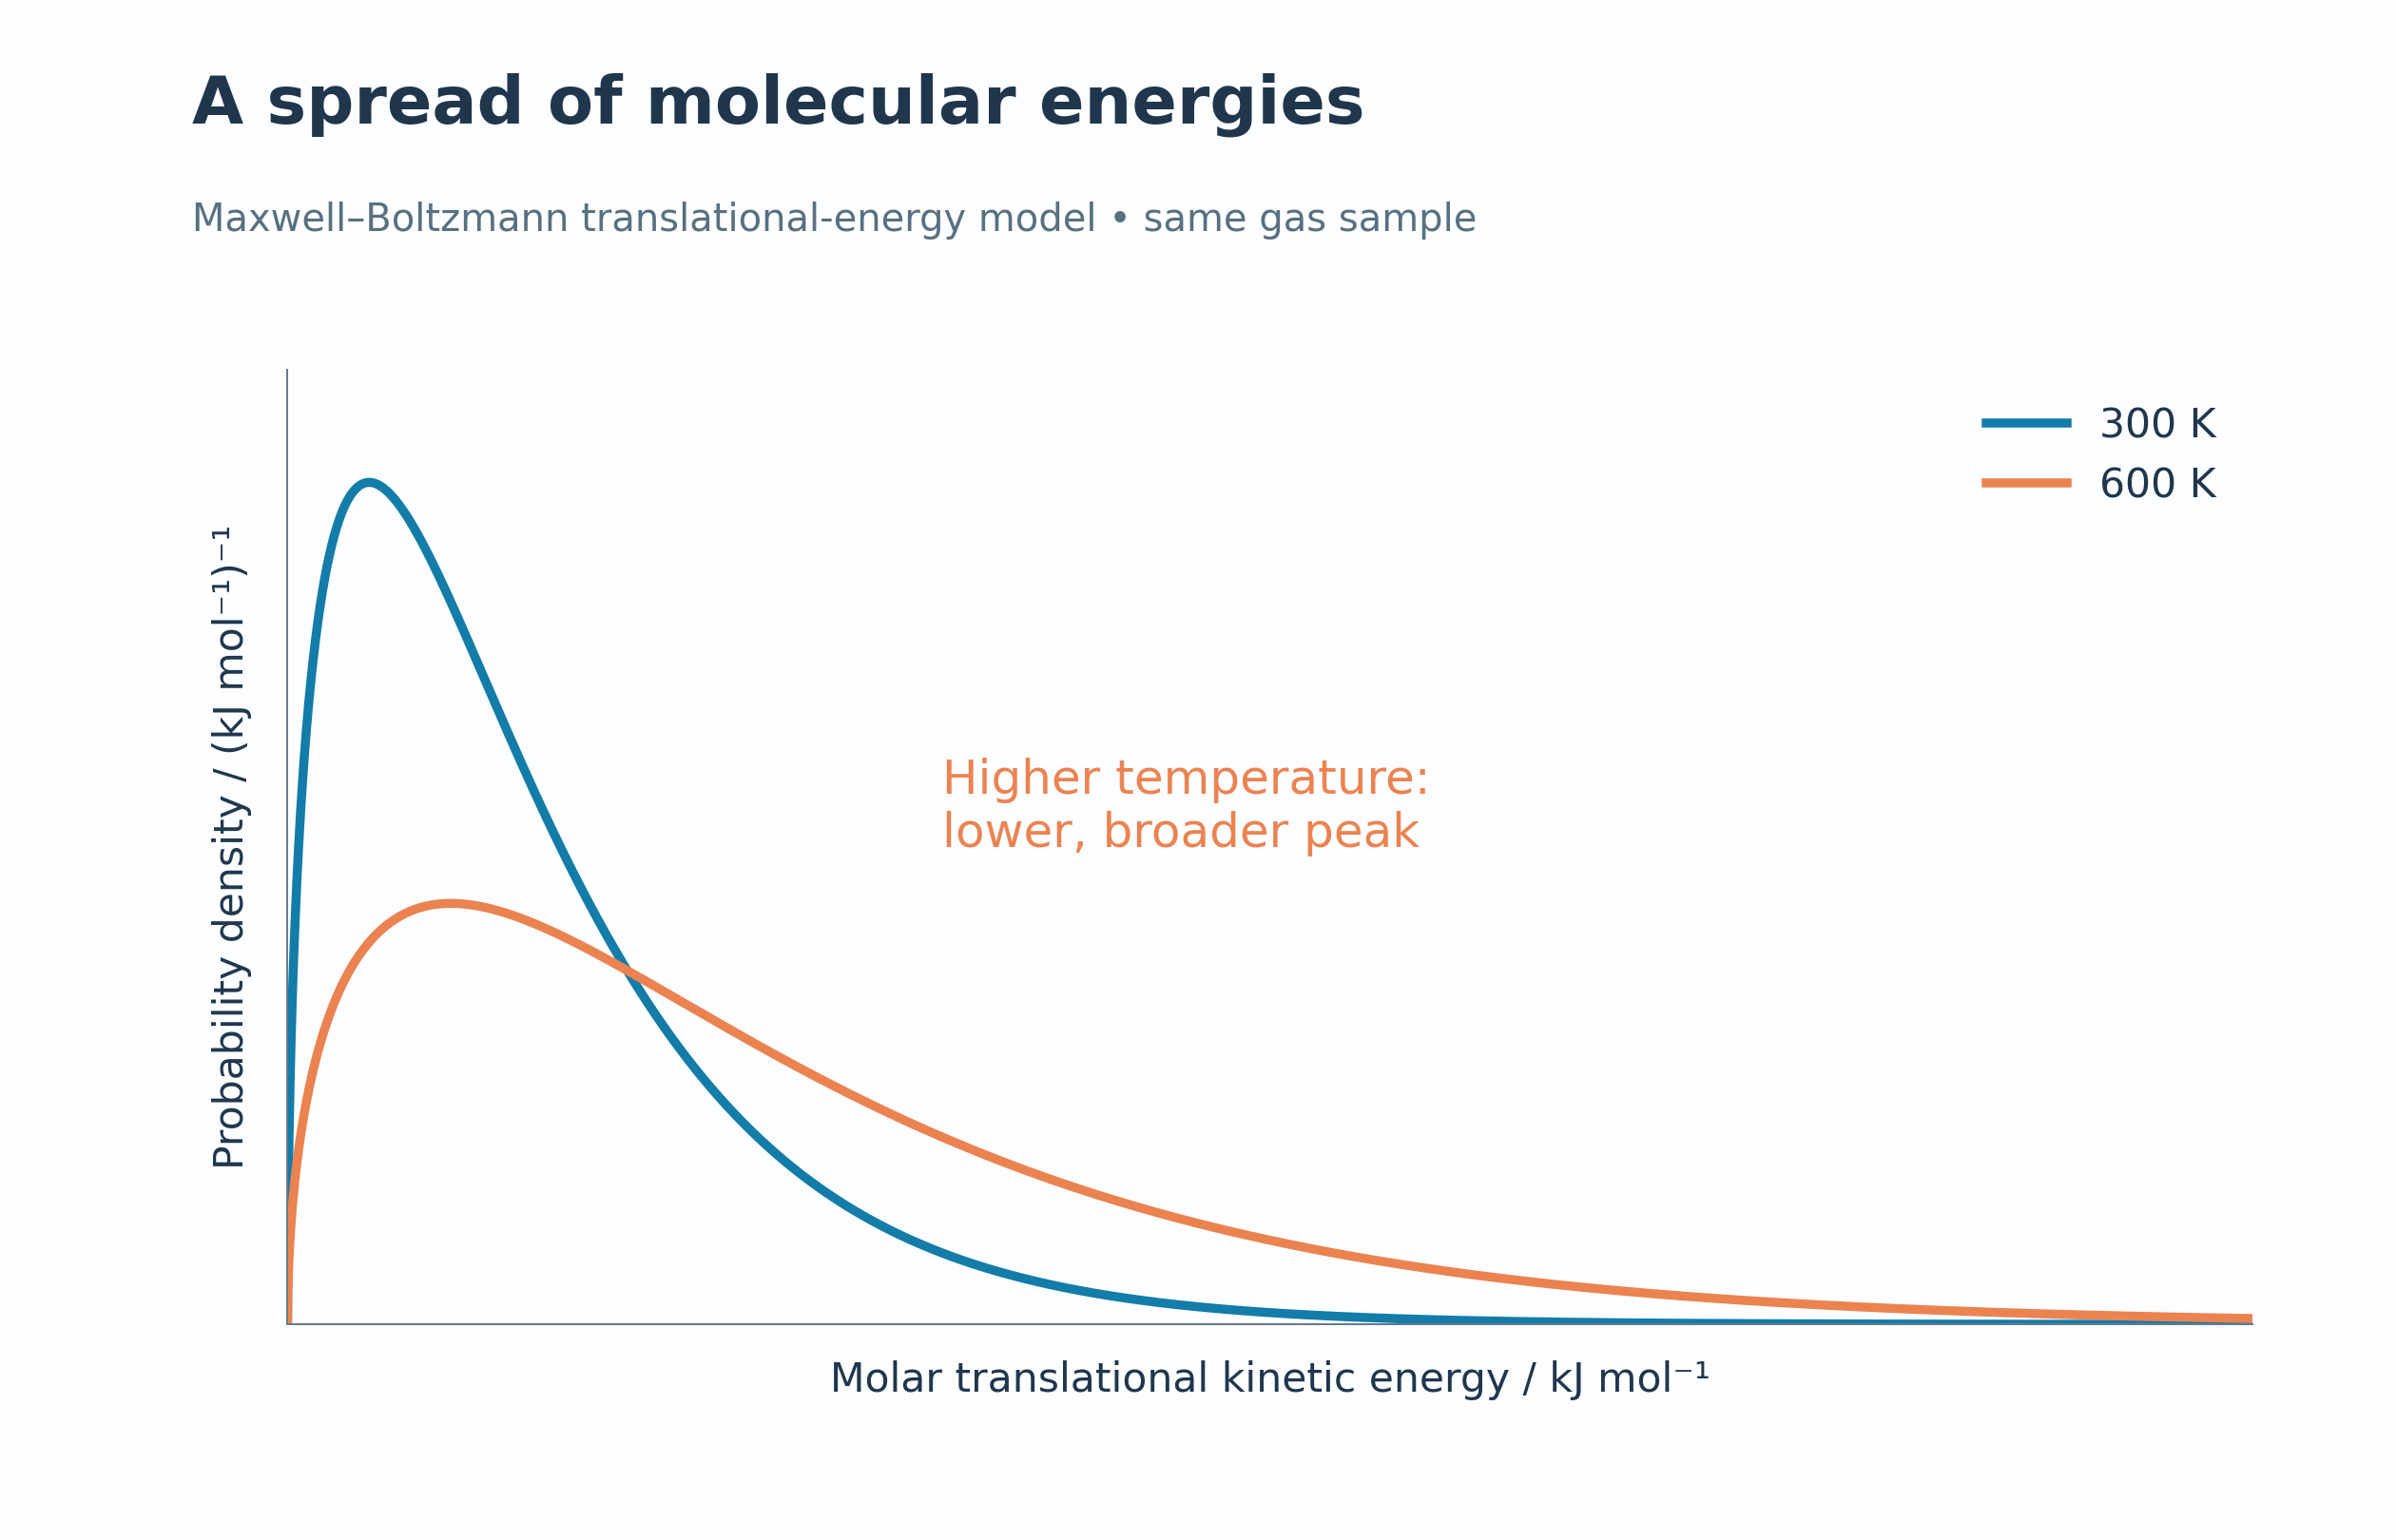
A spread of energies
Model distributions at 300 K and 600 K show a lower, broader peak at higher temperature.
Download original PNG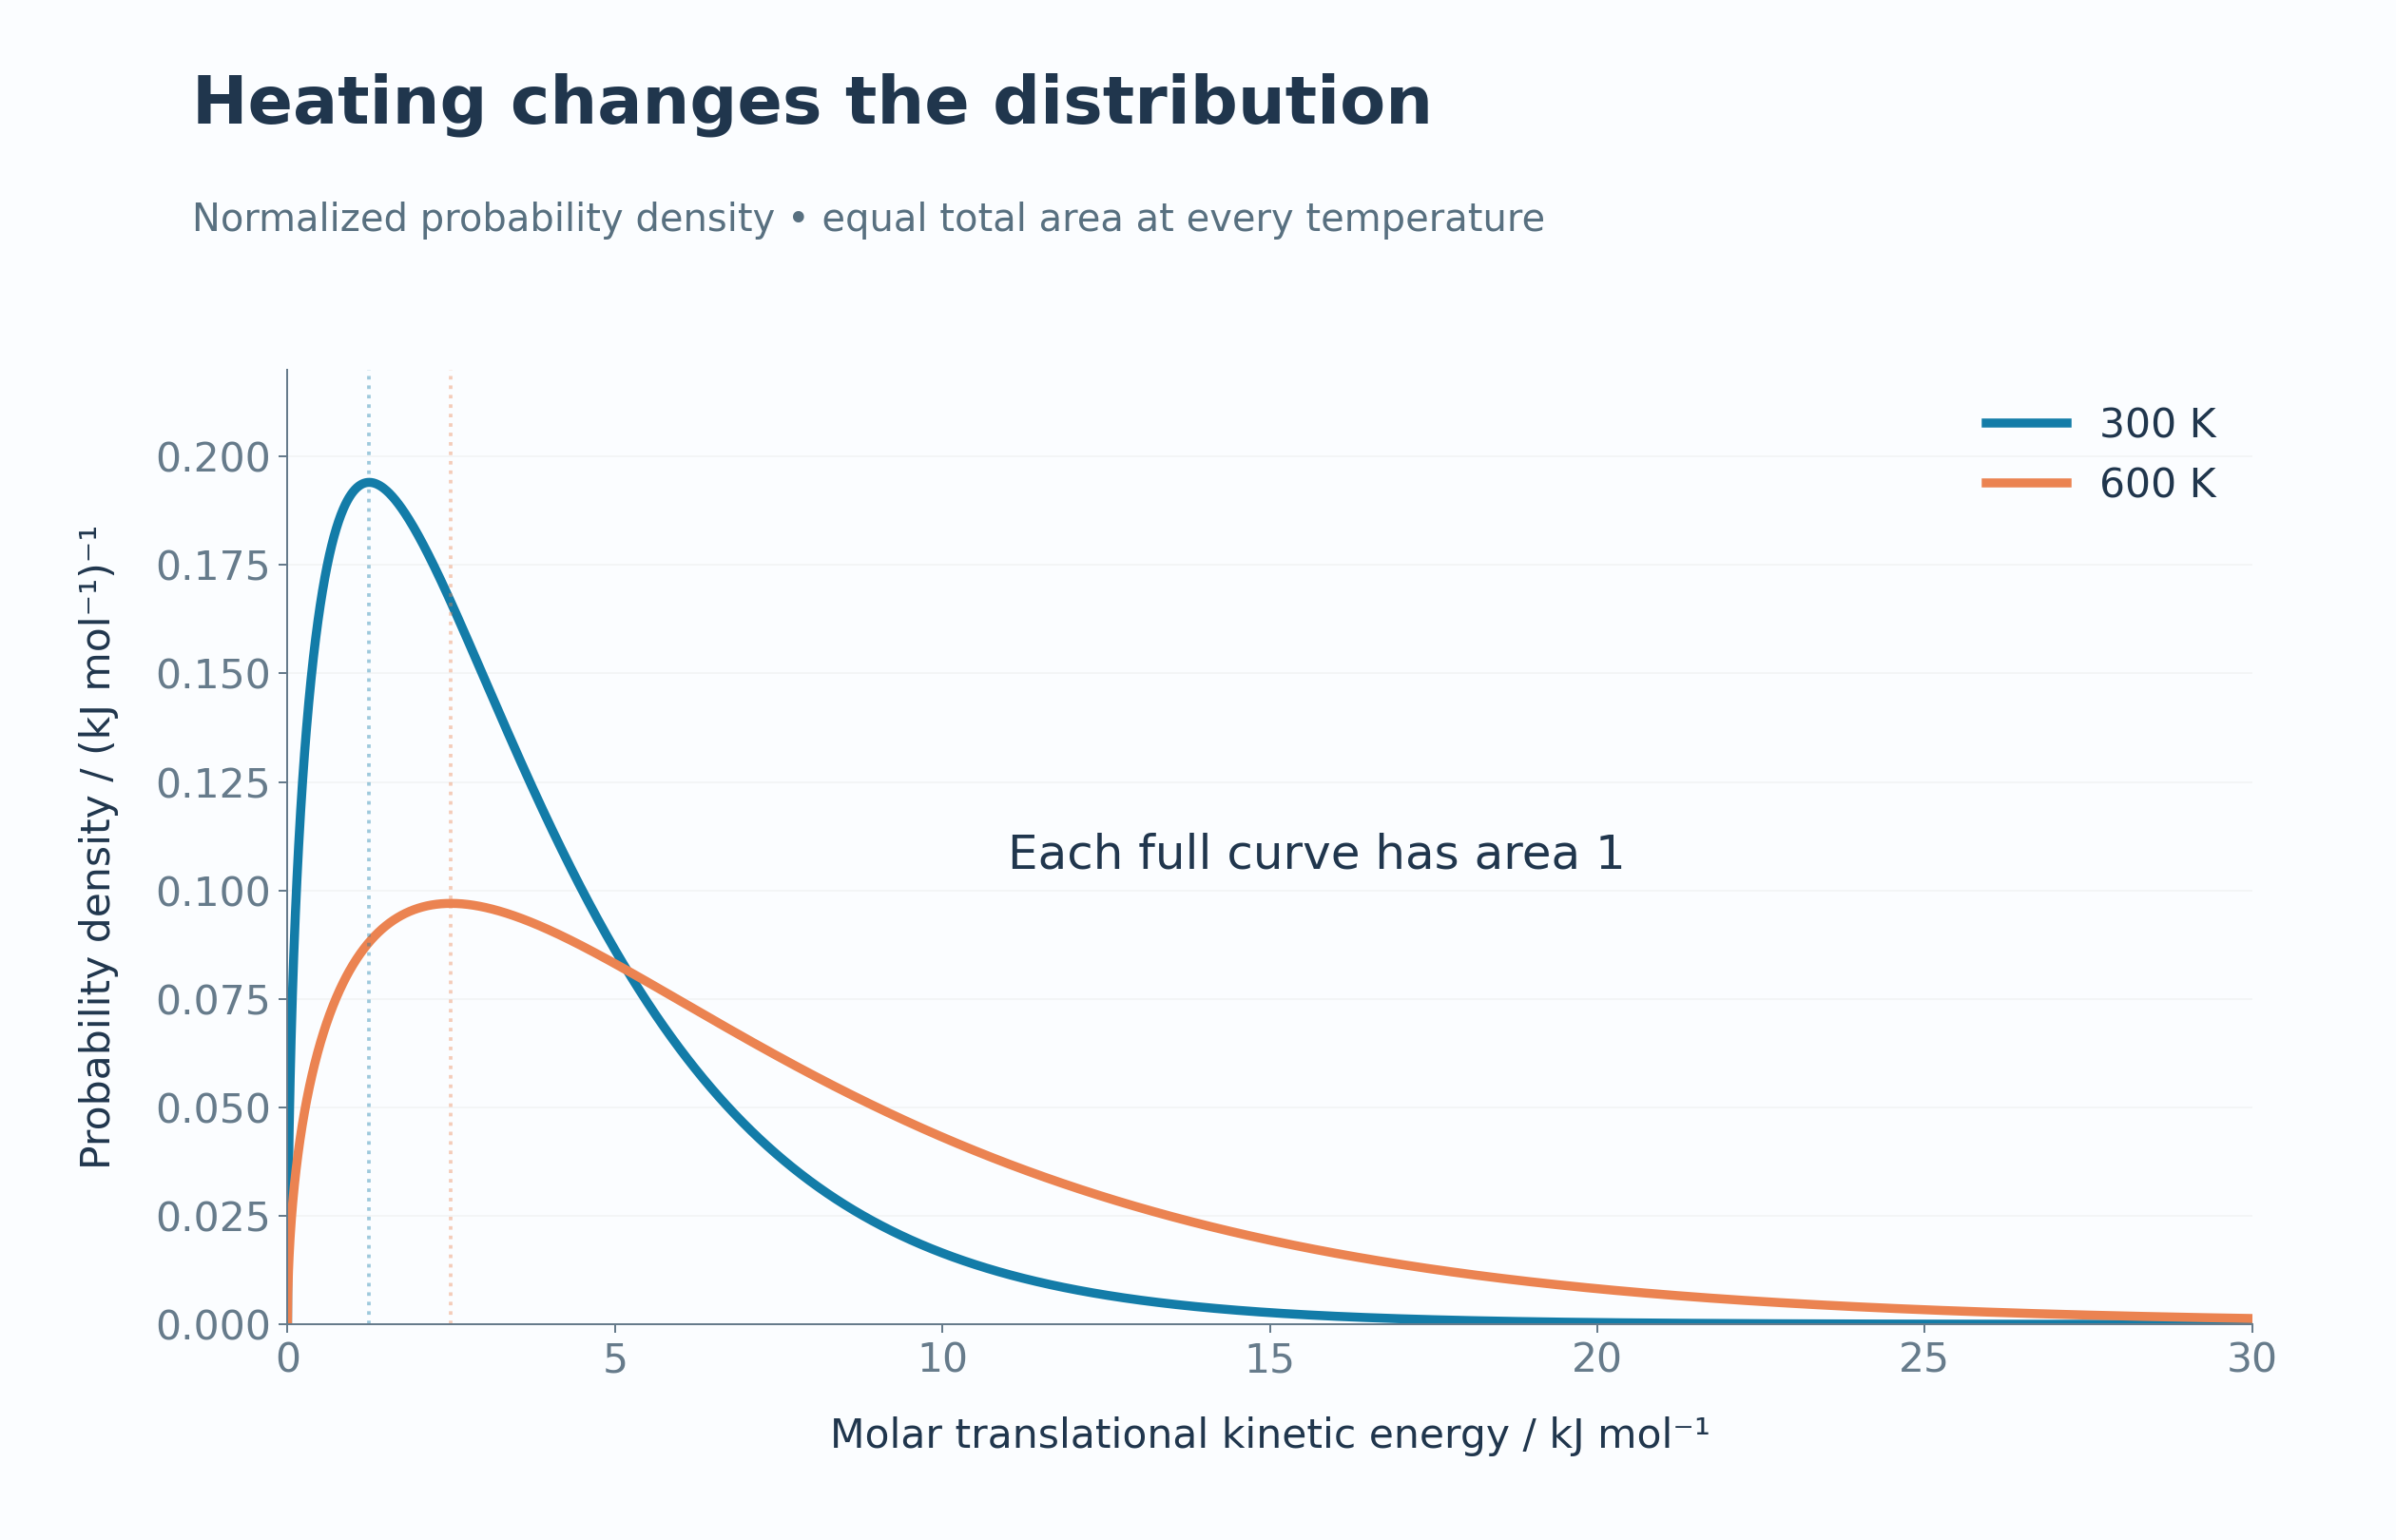
Calculated teaching model
Equal total area
Normalised energy-probability curves each have a total area of one.
Download original PNG
Calculated teaching model
A fixed threshold
A 12 kJ mol−1 illustrative threshold highlights the high-energy tail at two temperatures.
Download original PNG
Calculated teaching model
Heating versus catalysis
A fixed-temperature curve distinguishes lowering a barrier from changing the energy distribution.
Download original PNG
Calculated teaching model
Quantify the high-energy tail
Model fractions above 12 kJ mol−1 compare 2.21% at 300 K with 18.62% at 600 K.
Download original PNGAbout these representations
Calculated Maxwell–Boltzmann translational-energy probability distributions. Thresholds illustrate reasoning and are not exact reaction-rate predictions; molecular orientation also matters.