
Explore orbital shapes, wavefunction phase and nodes using analytical hydrogenic models.
Choose from five images below. Open an image for a closer look, download its original PNG, or download all five as a ZIP.
Use these visuals in your lesson
Start with the meaning of colour and a node before comparing orbital families. Keep phase distinct from electric charge.
A question to discuss
Why should the two colours on an orbital not be interpreted as positive and negative charge?
Atomic orbital shapes: five teaching visuals

Calculated teaching model
Spherical and directional orbitals
Hydrogenic 1s and 2p wavefunction surfaces compare spherical symmetry with two lobes and a nodal plane.
Download original PNG
Calculated teaching model
Three perpendicular 2p orbitals
Three equal-magnitude hydrogenic wavefunction surfaces show 2px, 2py and 2pz orientations.
Download original PNG
Calculated teaching model
A radial node changes phase
Equatorial slices compare 1s with the radial node in 2s, using colour for phase and brightness for wavefunction magnitude.
Download original PNG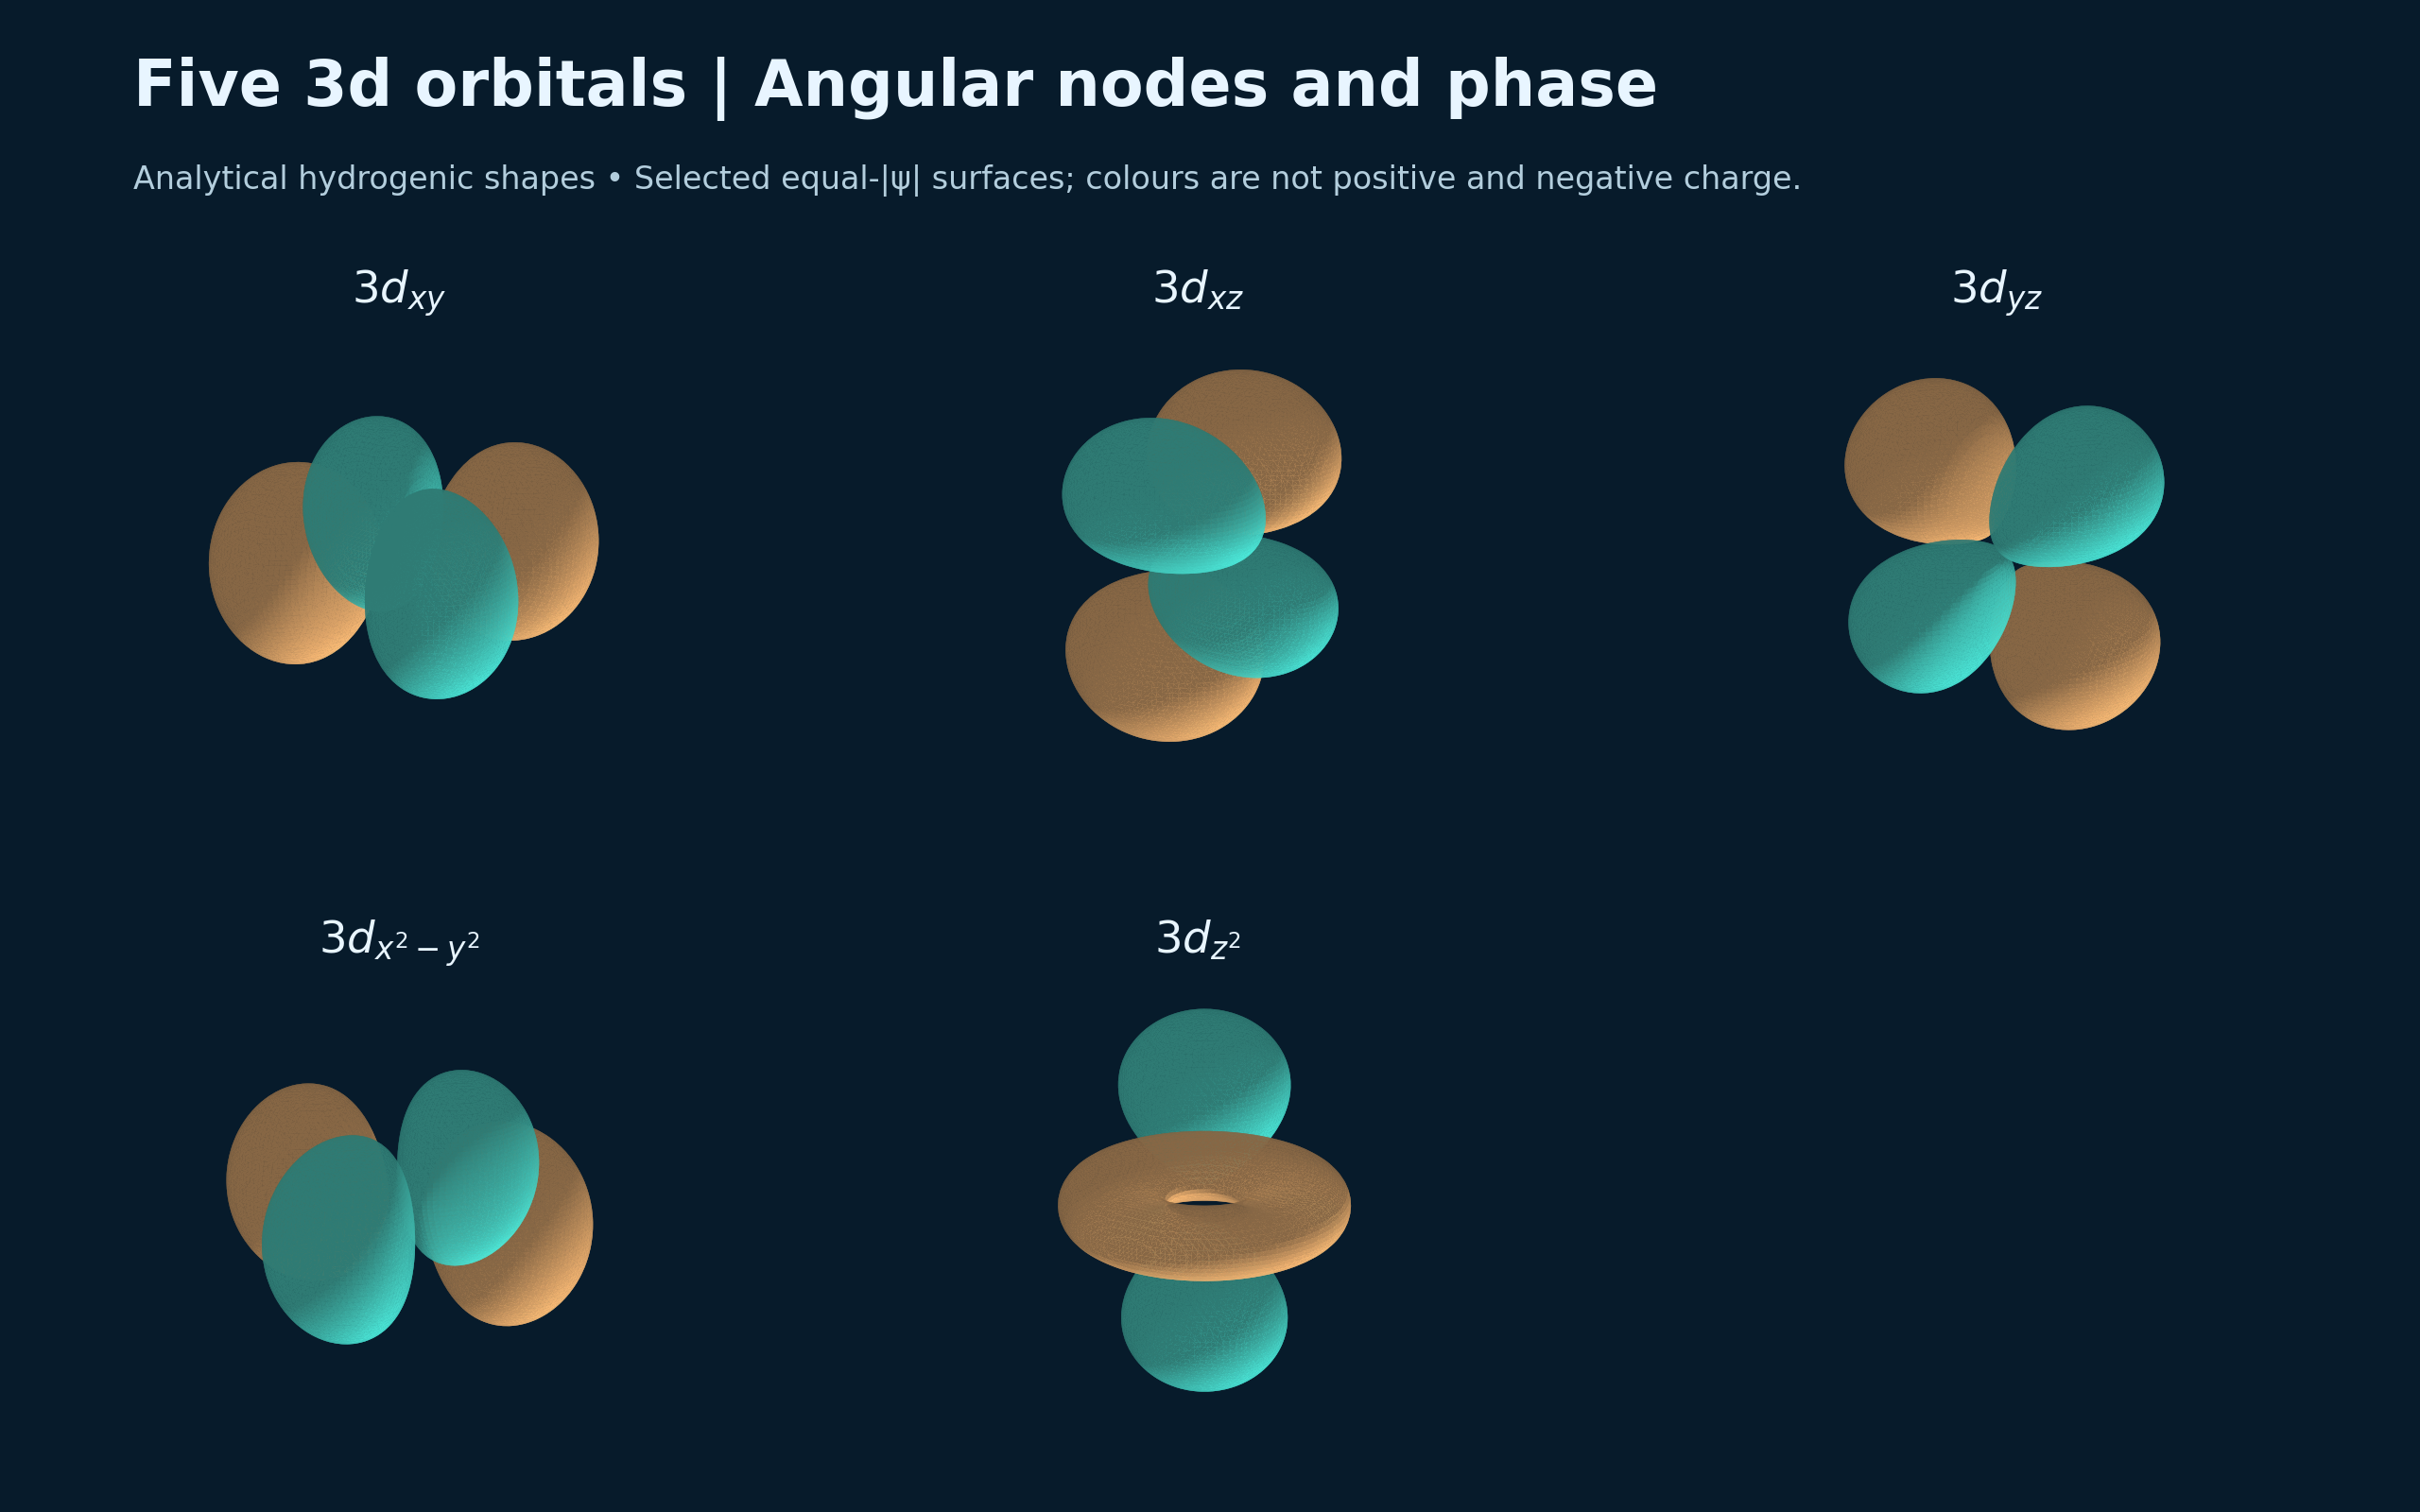
Calculated teaching model
Five 3d orbitals
Analytical hydrogenic surfaces compare the shapes and phases of five 3d orbitals.
Download original PNG
Calculated teaching model
Sigma and pi combinations
Conceptual p-orbital superpositions contrast end-on and side-on bonding overlap.
Download original PNGAbout these representations
Analytical hydrogenic wavefunction surfaces and slices, not electron trajectories. Colours indicate sign of the wavefunction. The overlap panel is a conceptual superposition, not a self-consistent molecular calculation.