
Compare catalysed and uncatalysed pathways without changing reactant or product energy levels.
Choose from five images below. Open an image for a closer look, download its original PNG, or download all five as a ZIP.
Use these visuals in your lesson
Have students mark activation energy and enthalpy change separately before discussing a catalyst.
A question to discuss
Why does a catalyst change how quickly equilibrium is reached but not its position?
Catalysed and uncatalysed reaction profiles: five teaching visuals
Qualitative diagram
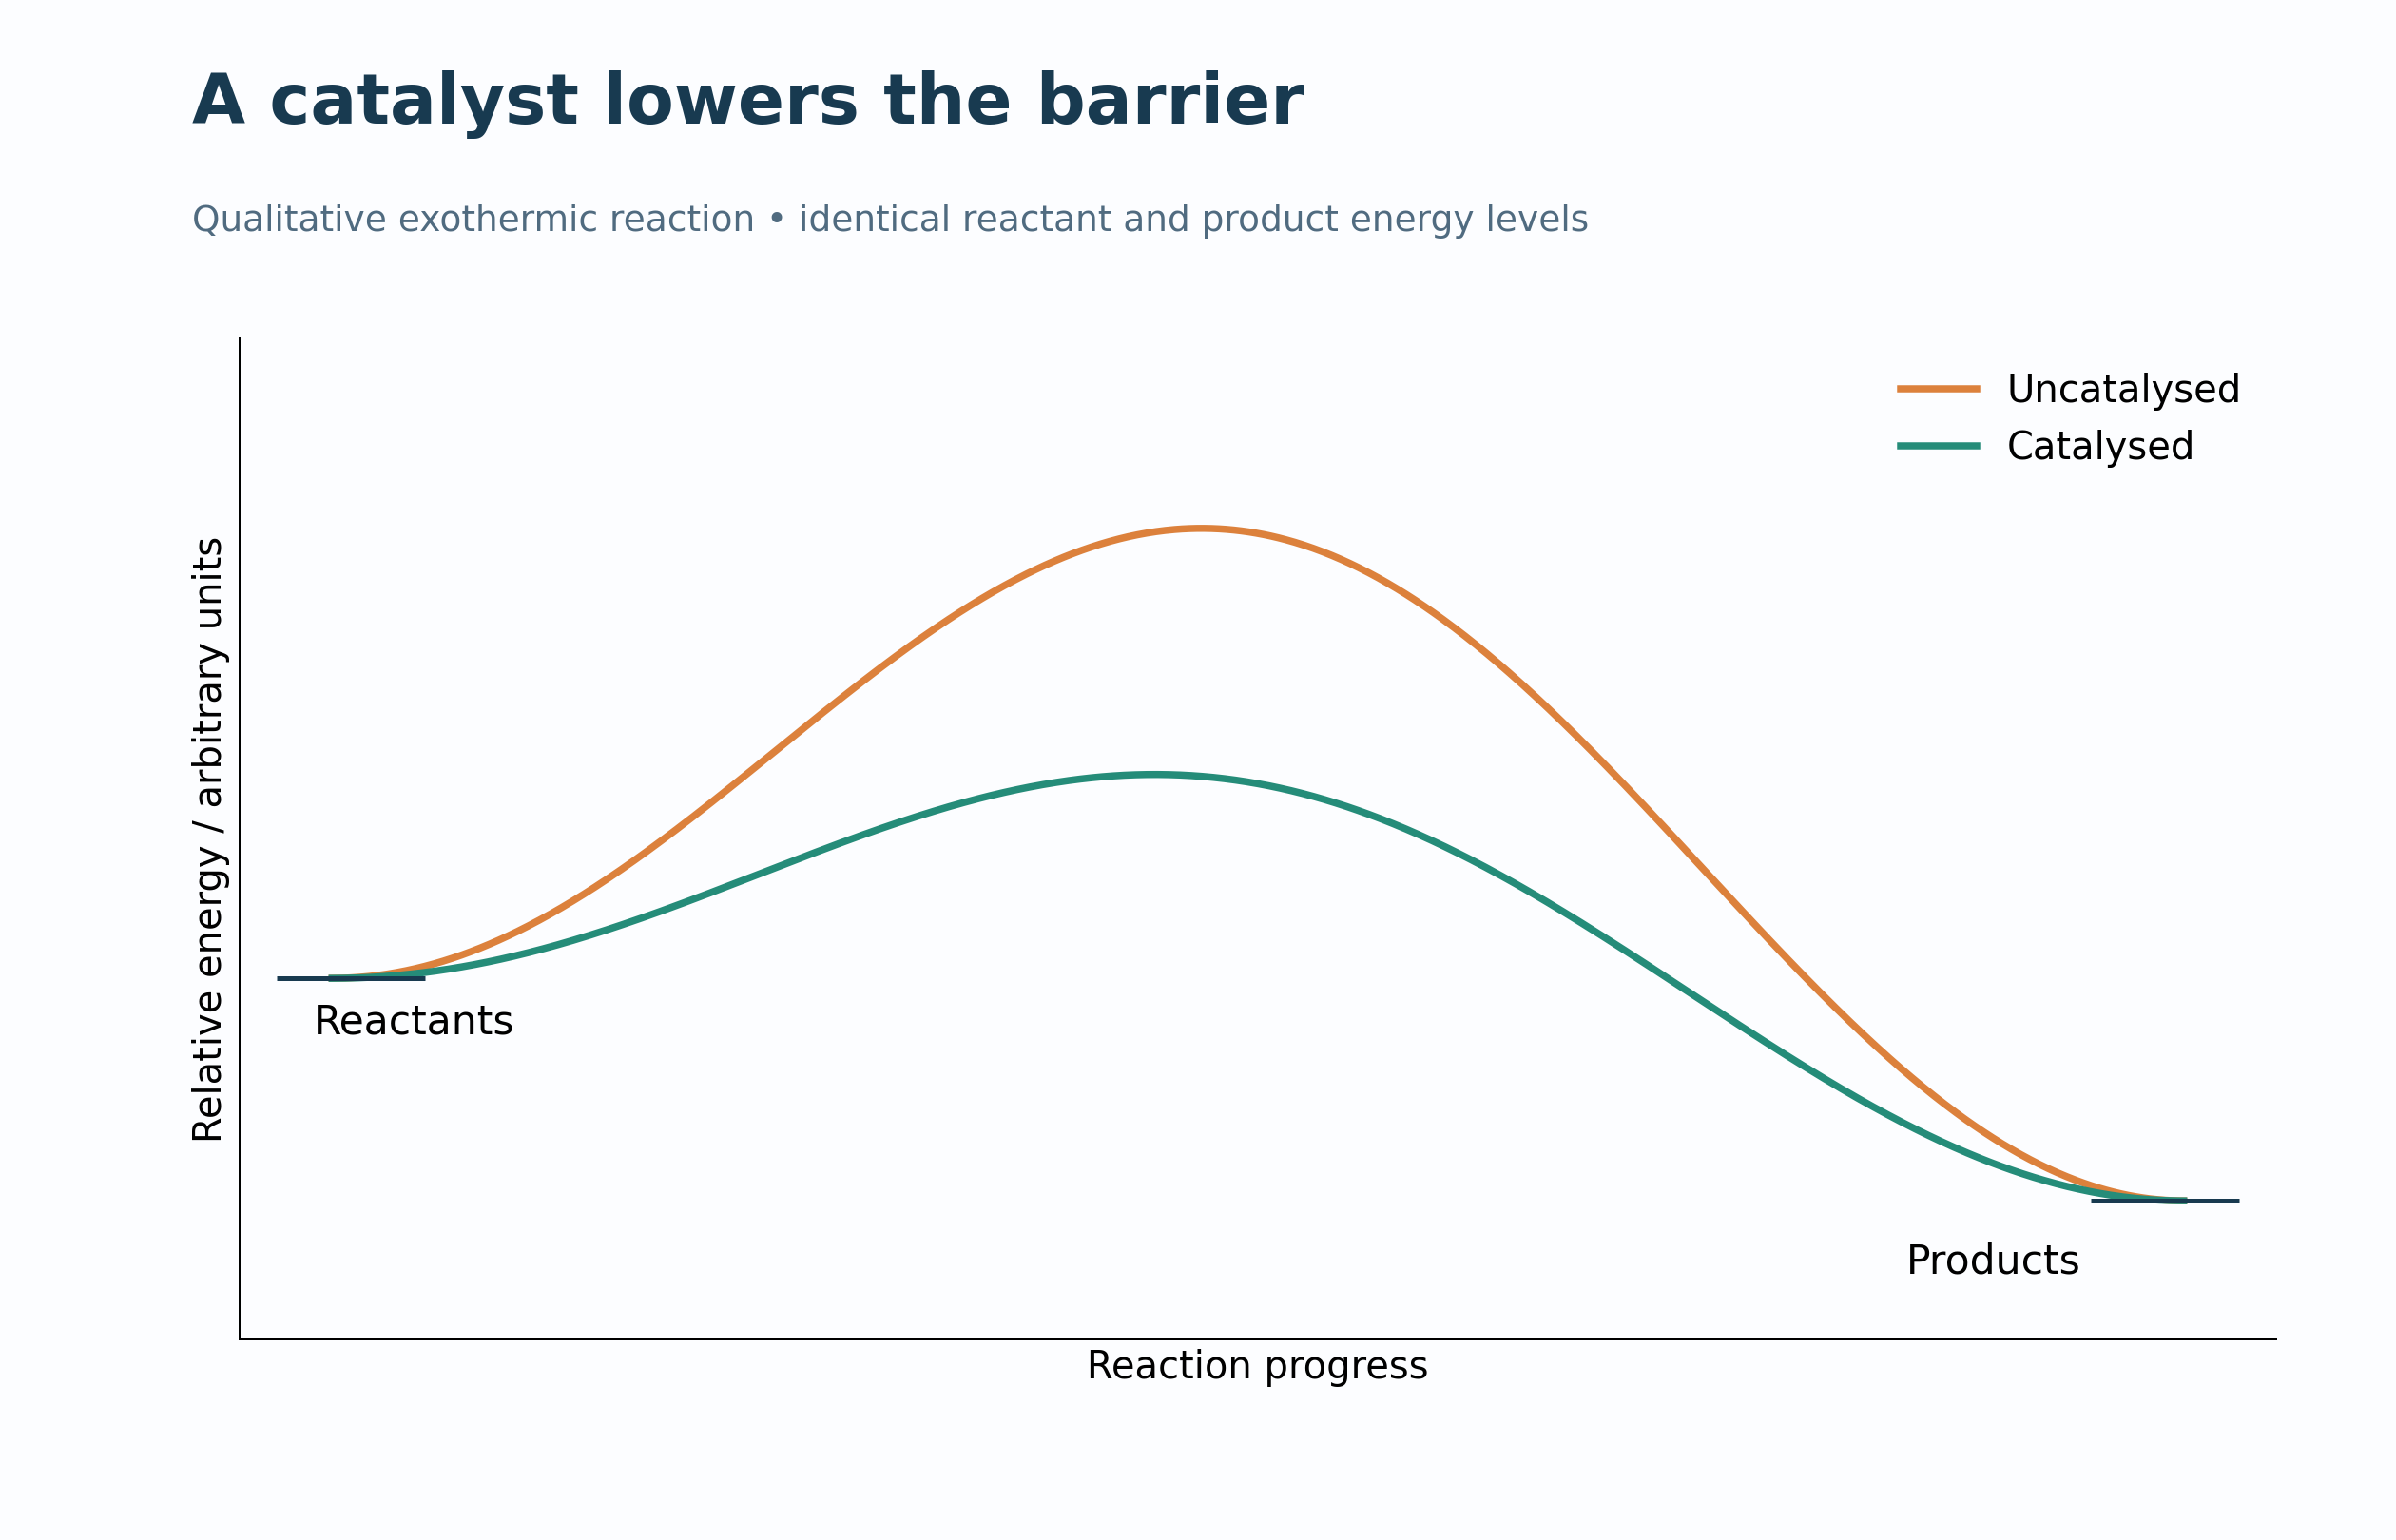
A lower barrier
Qualitative exothermic profiles compare catalysed and uncatalysed routes.
Download original PNG
Qualitative diagram
The same enthalpy change
Activation-energy arrows differ while reactant-to-product enthalpy change remains the same.
Download original PNG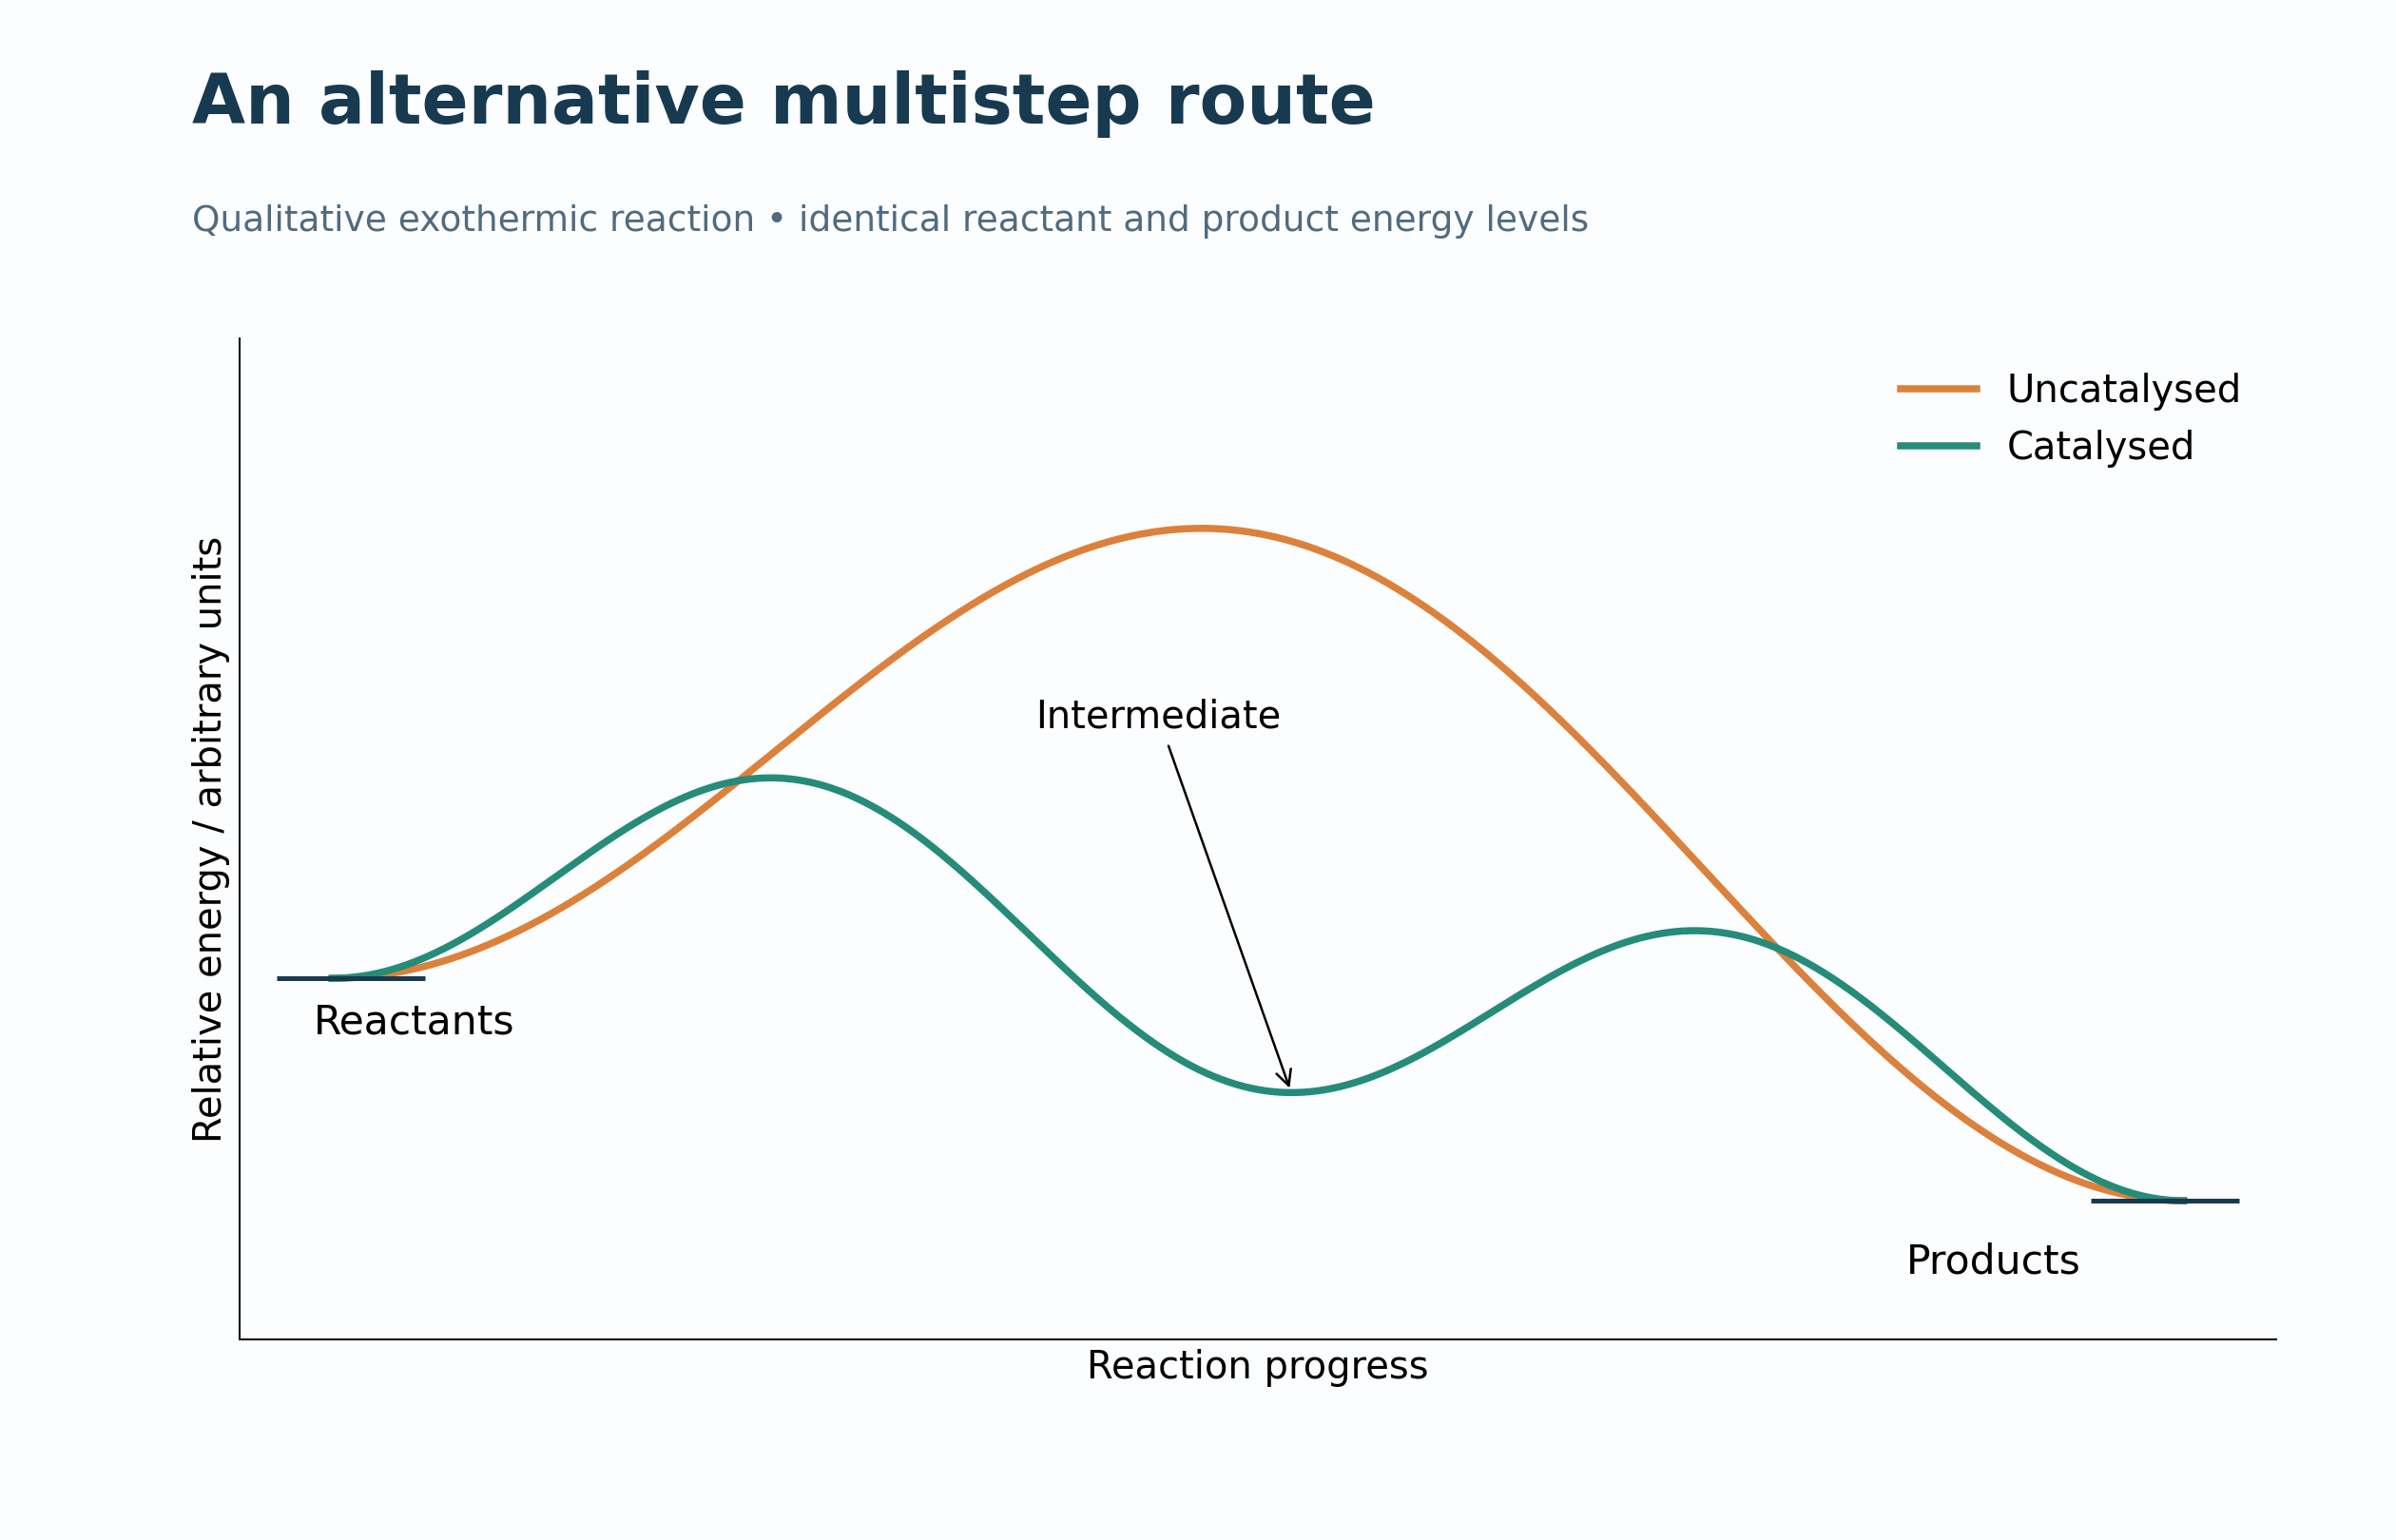
Qualitative diagram
A multistep alternative
A two-step catalysed pathway contains an intermediate between two transition-state peaks.
Download original PNG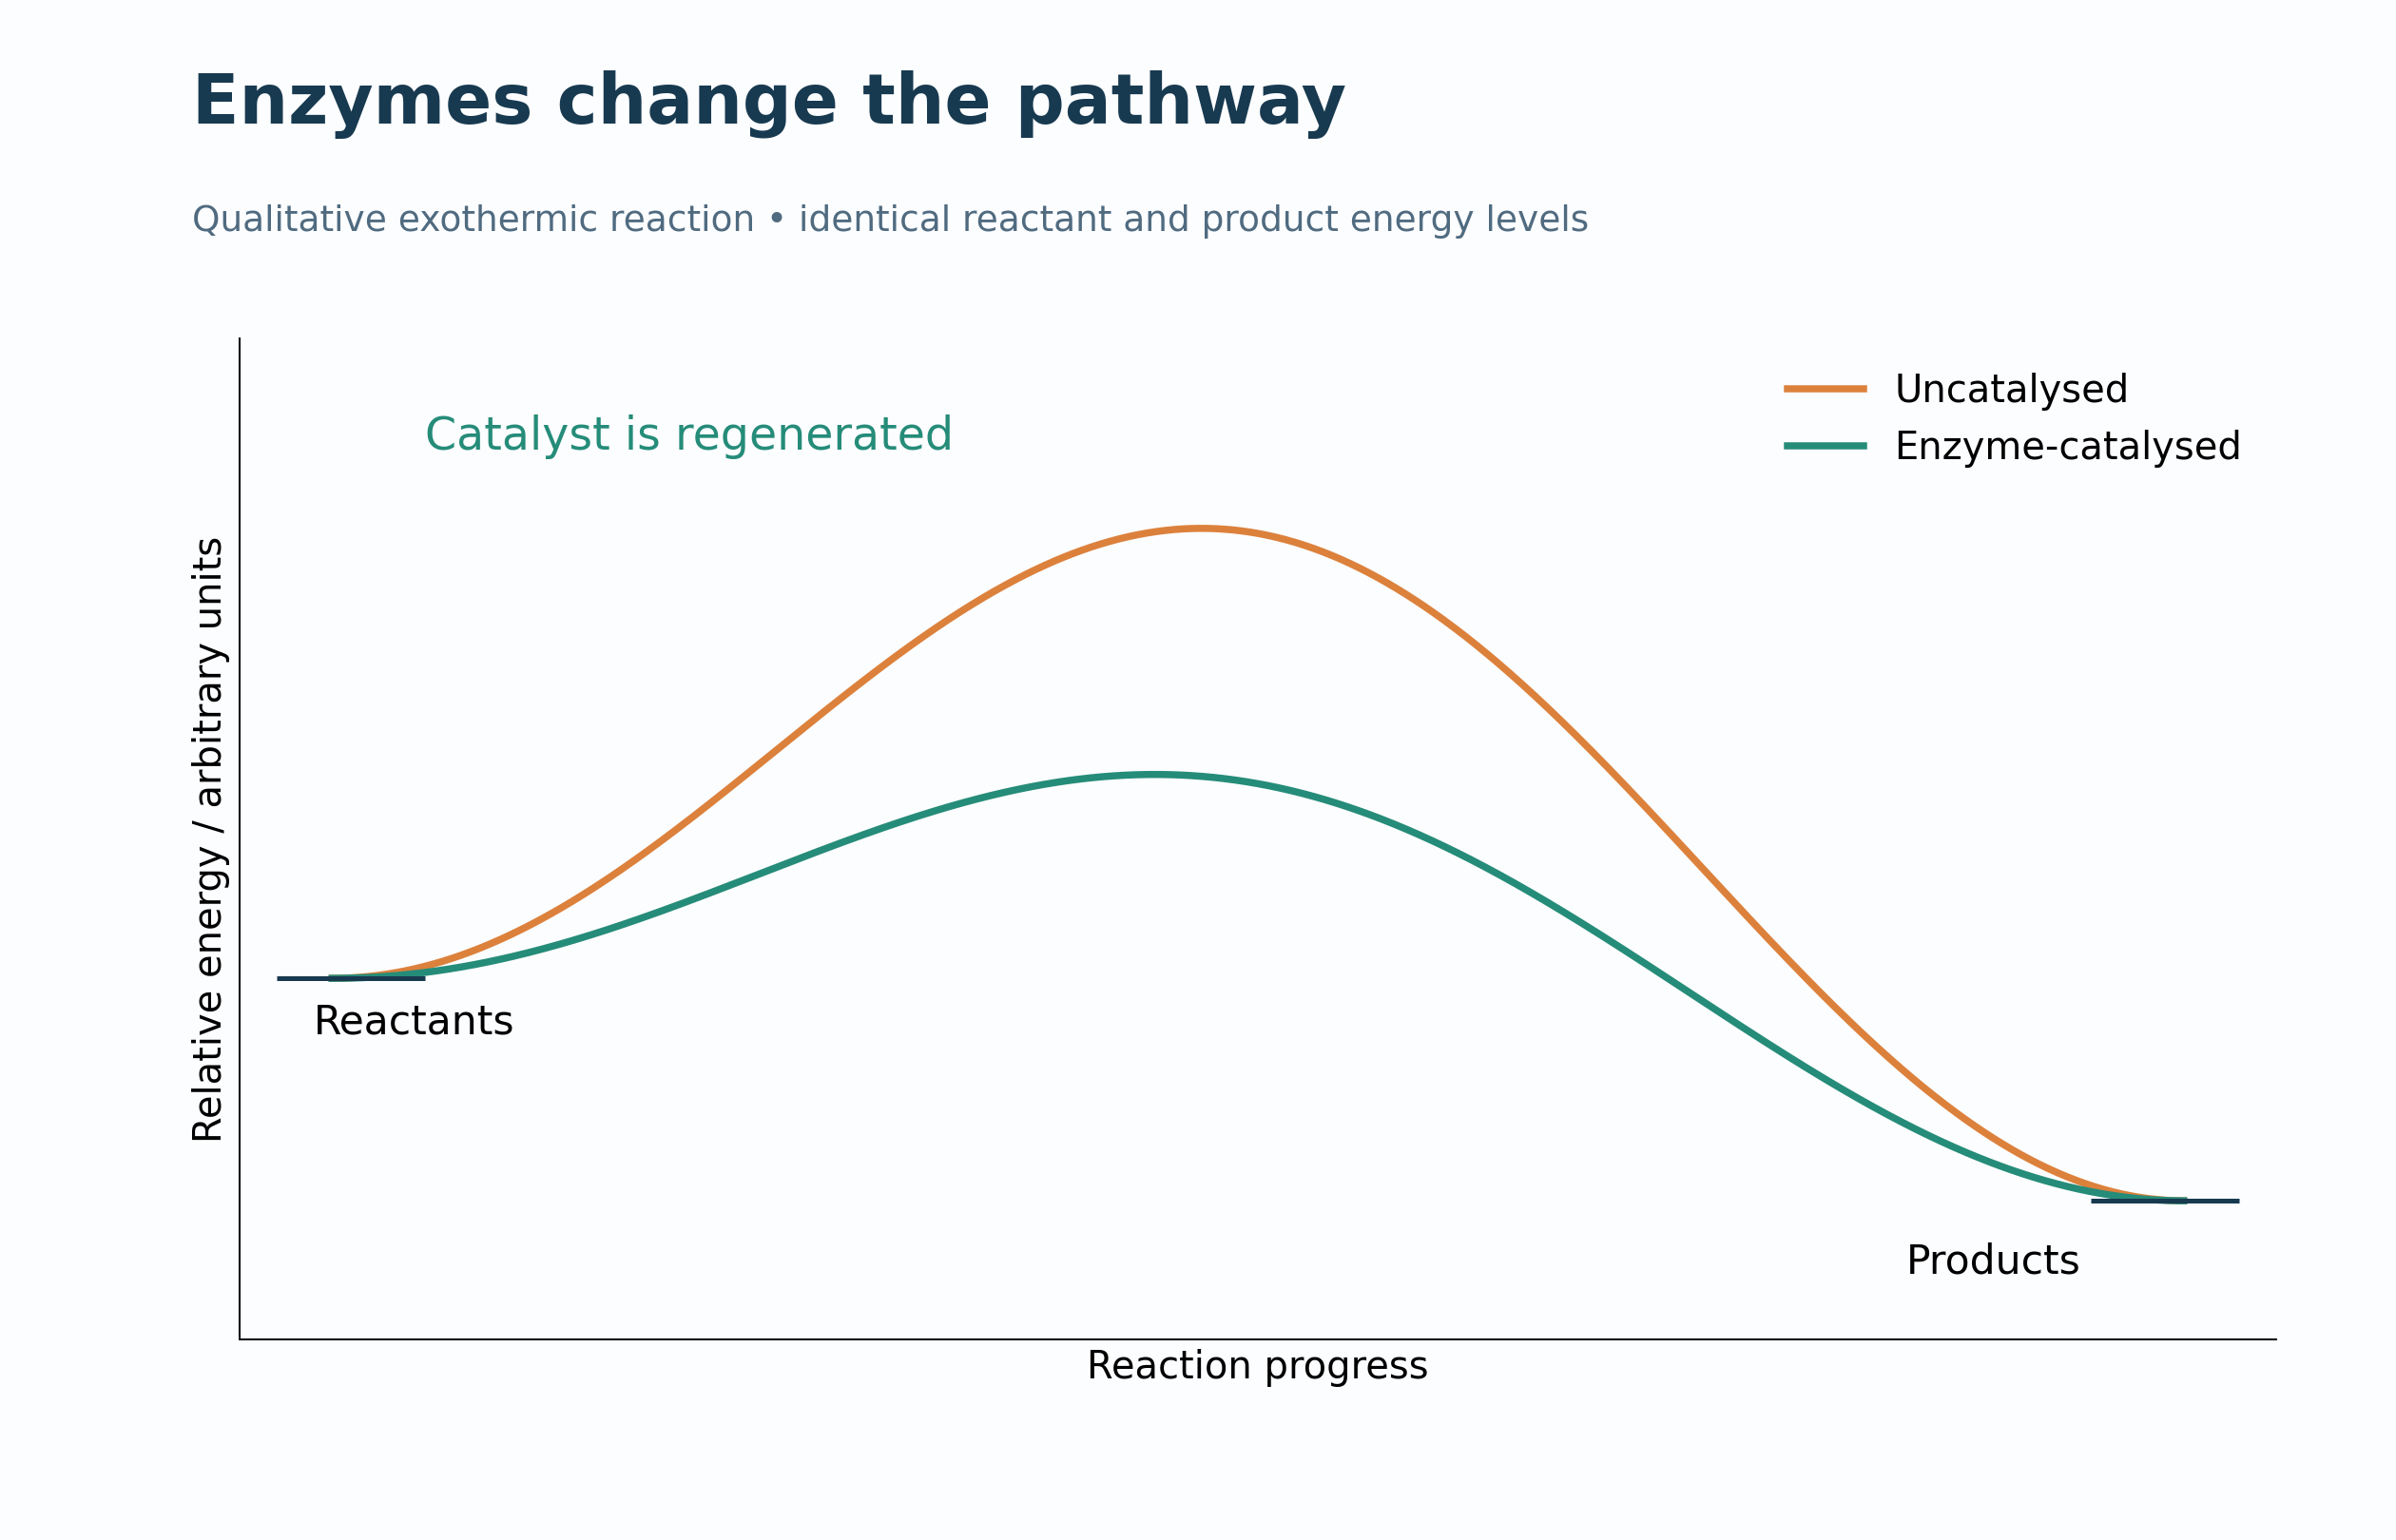
Qualitative diagram
Enzymes change the pathway
A qualitative enzyme-catalysed profile illustrates a lower barrier and catalyst regeneration.
Download original PNG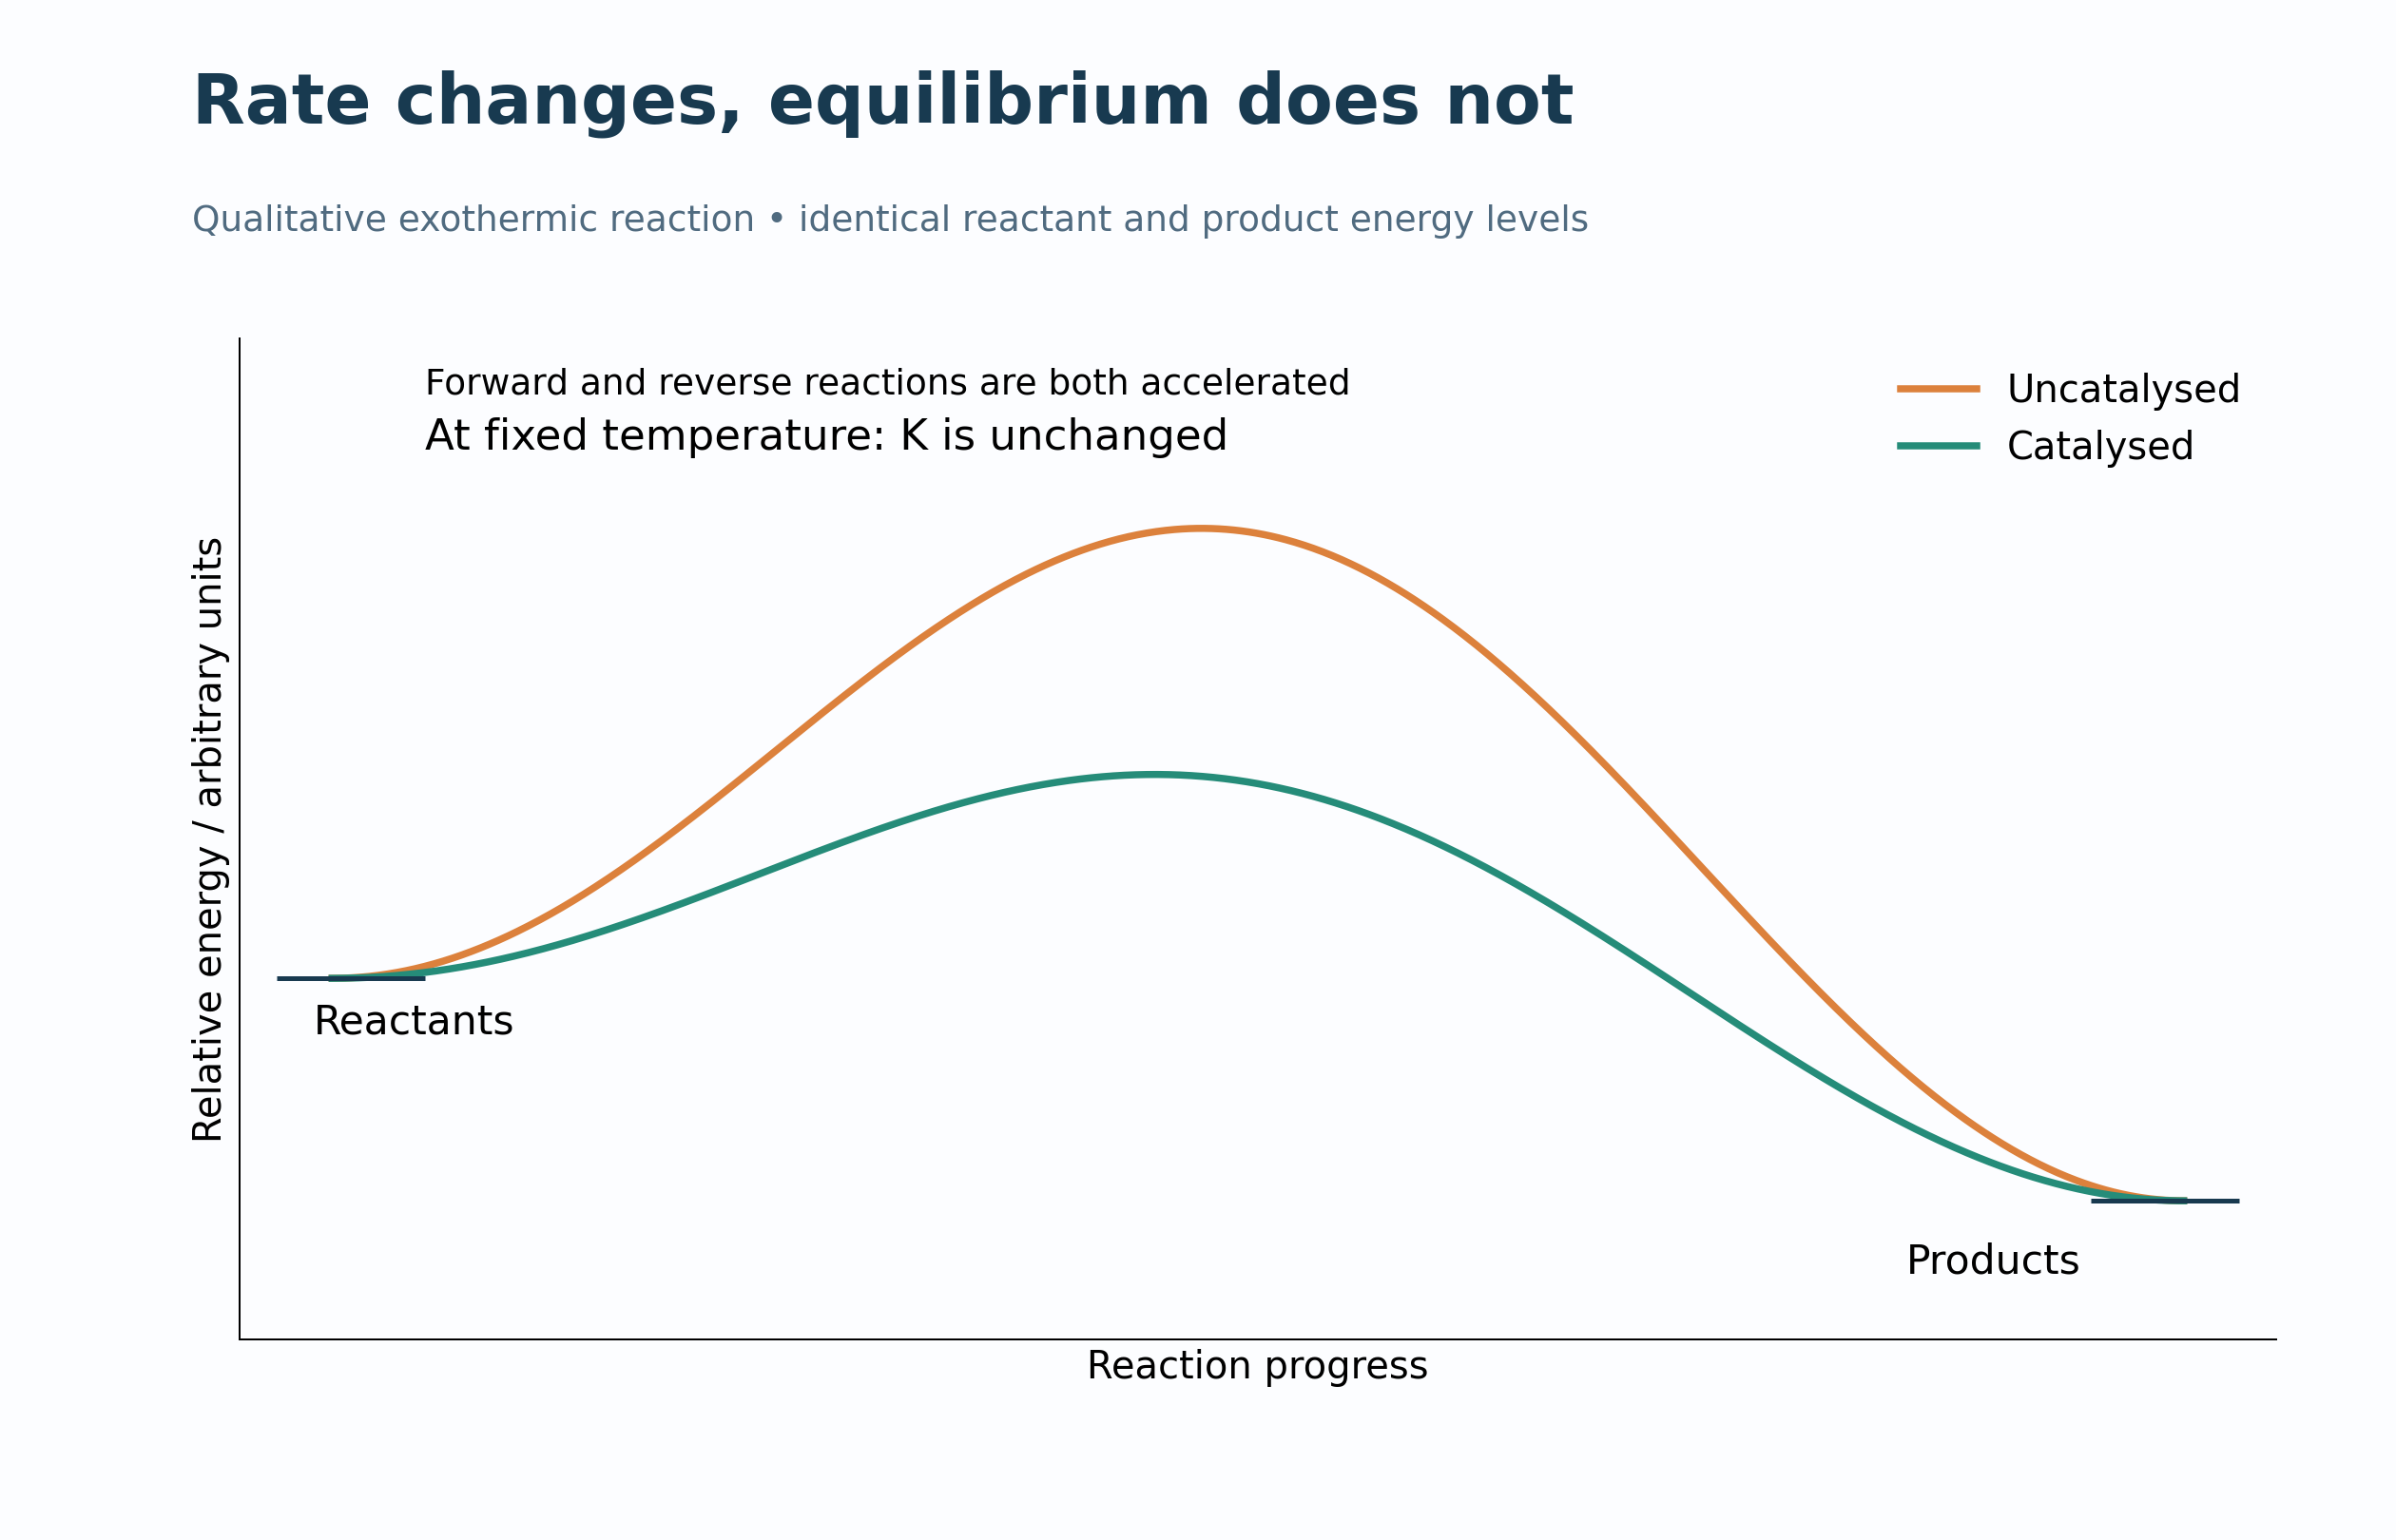
Qualitative diagram
Rate changes, equilibrium does not
Profiles explain faster forward and reverse reactions without changing the equilibrium constant at fixed temperature.
Download original PNGAbout these representations
Qualitative energy profiles in arbitrary units, not measured reaction energetics or an experimentally assigned mechanism.