
Read strong- and weak-acid titration curves and connect their shapes with buffer regions and equivalence points.
Choose from five images below. Open an image for a closer look, download its original PNG, or download all five as a ZIP.
Use these visuals in your lesson
Ask students to locate equivalence and half-equivalence before choosing an indicator from its transition range.
A question to discuss
Why is the equivalence-point pH above seven for ethanoic acid titrated with sodium hydroxide?
Strong-acid and weak-acid titration curves: five teaching visuals
Calculated teaching model
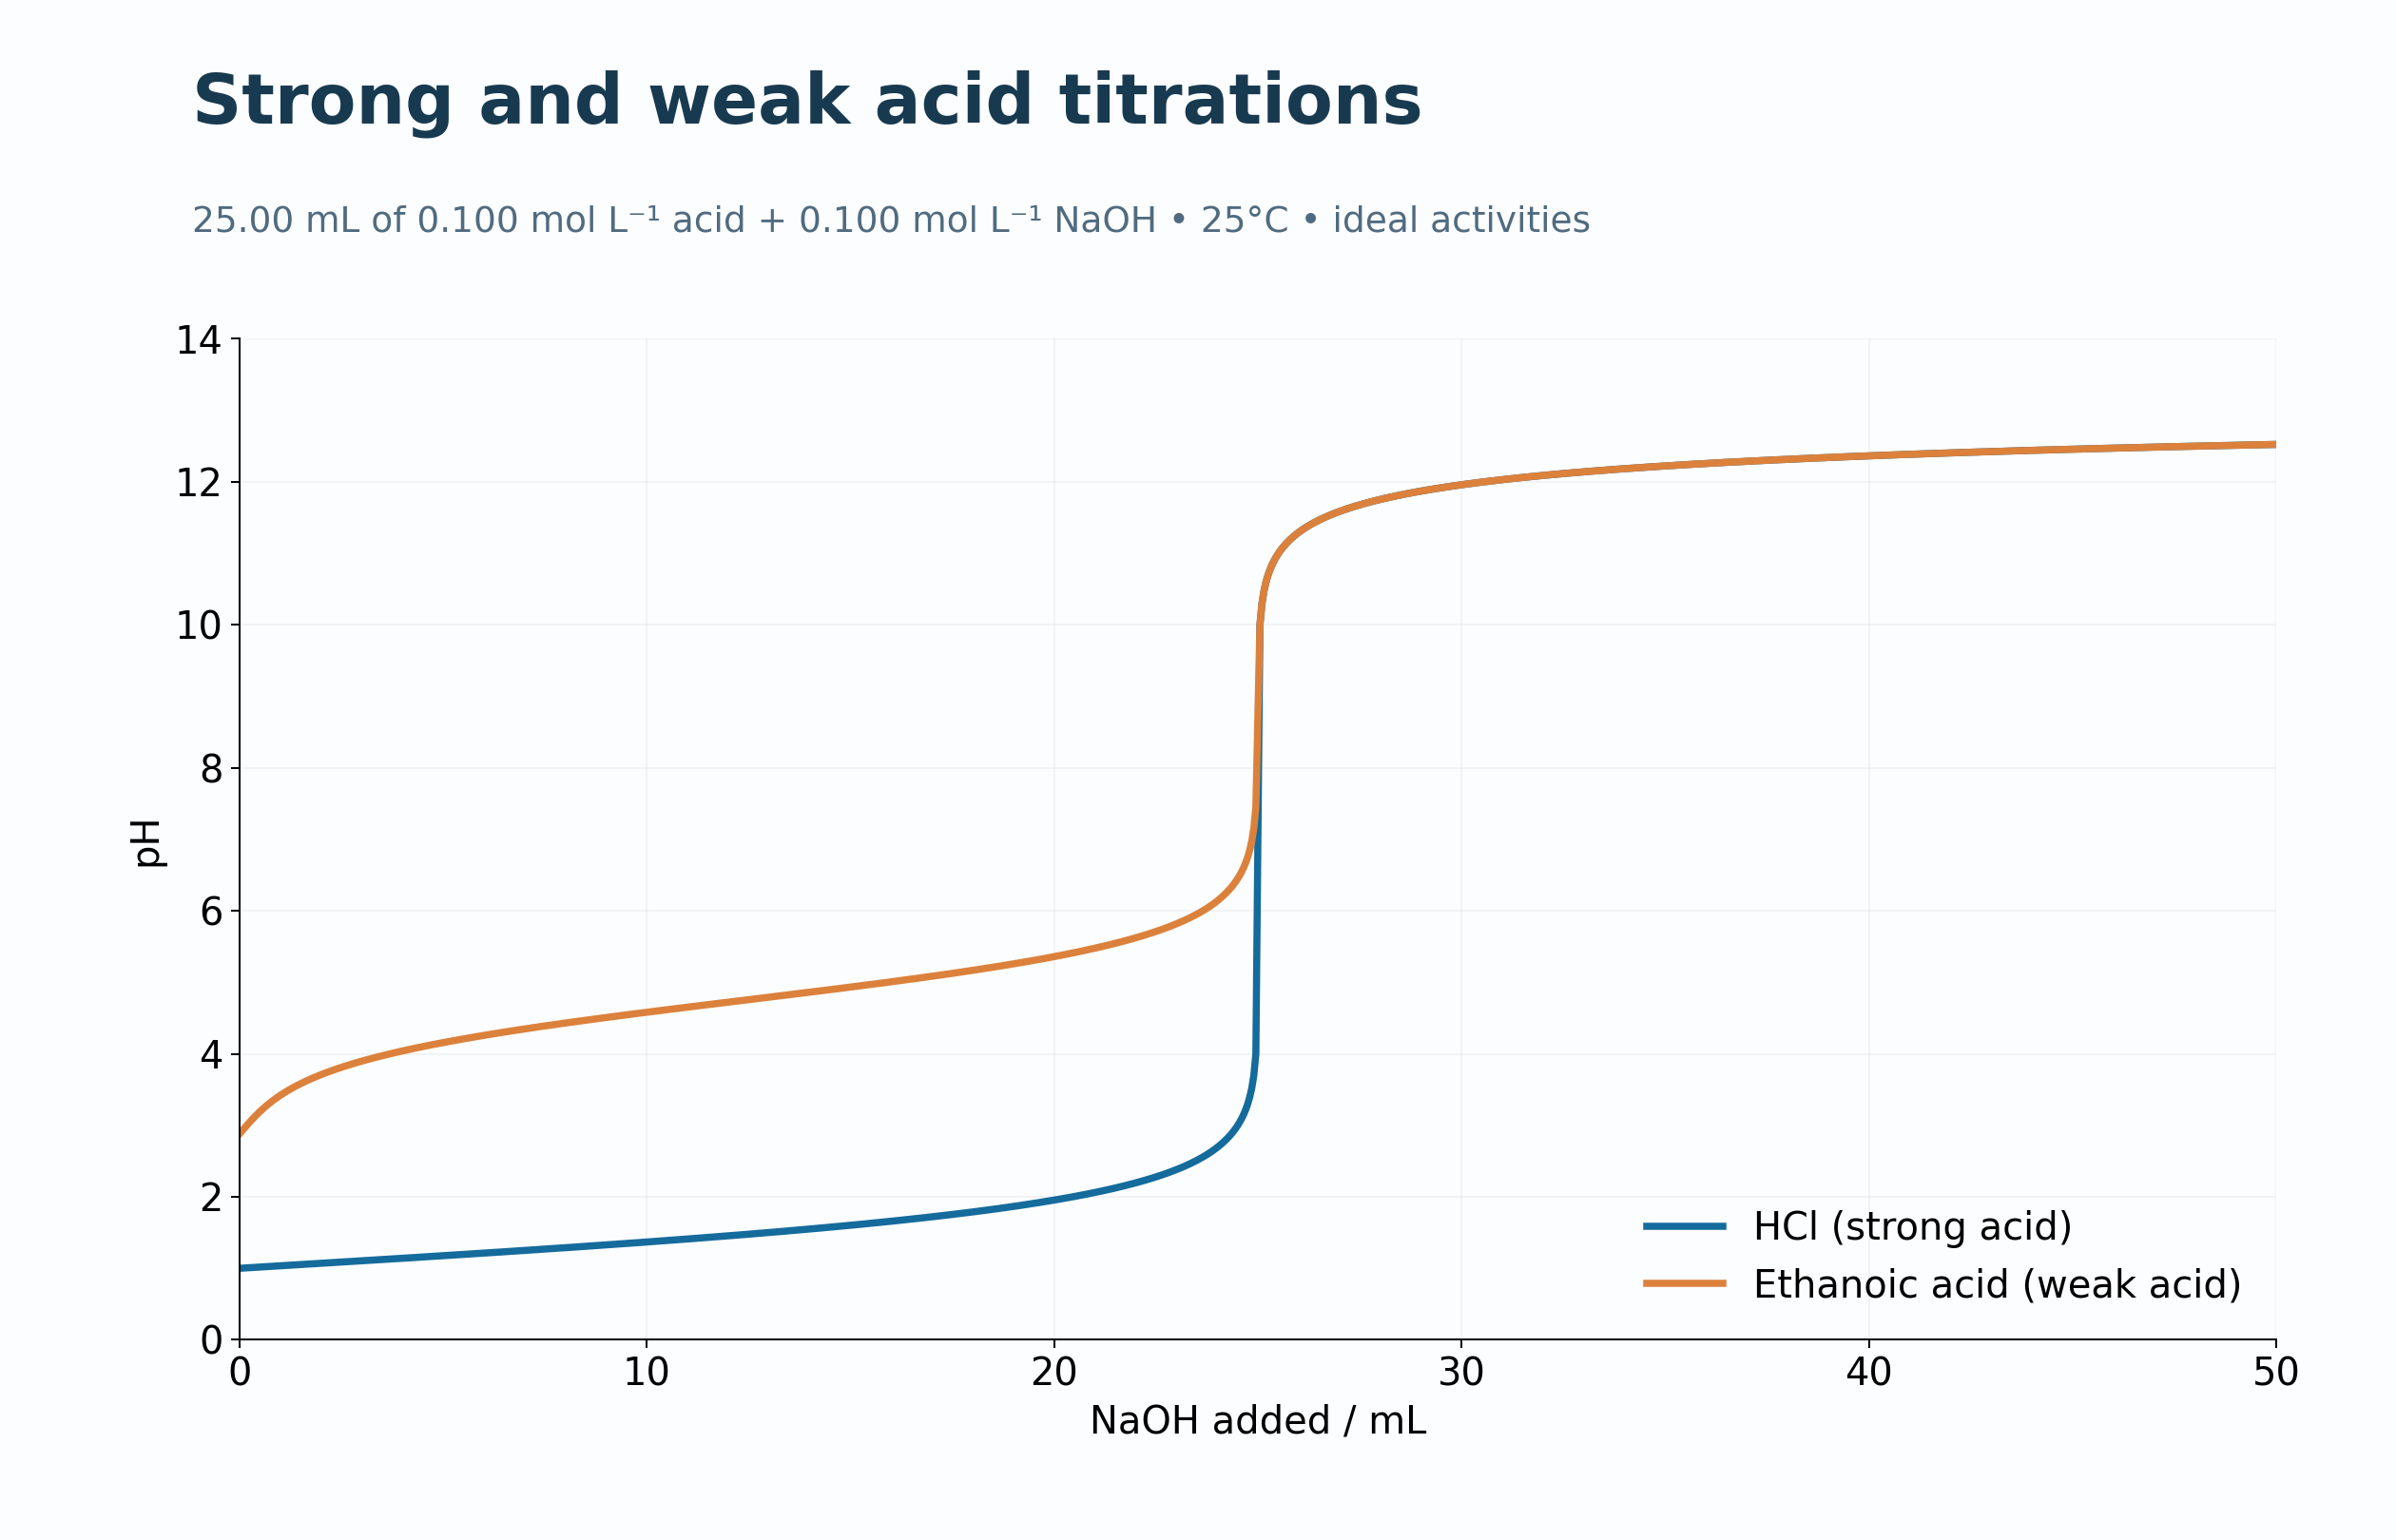
Strong and weak acids
Model curves compare hydrochloric and ethanoic acids titrated with sodium hydroxide.
Download original PNG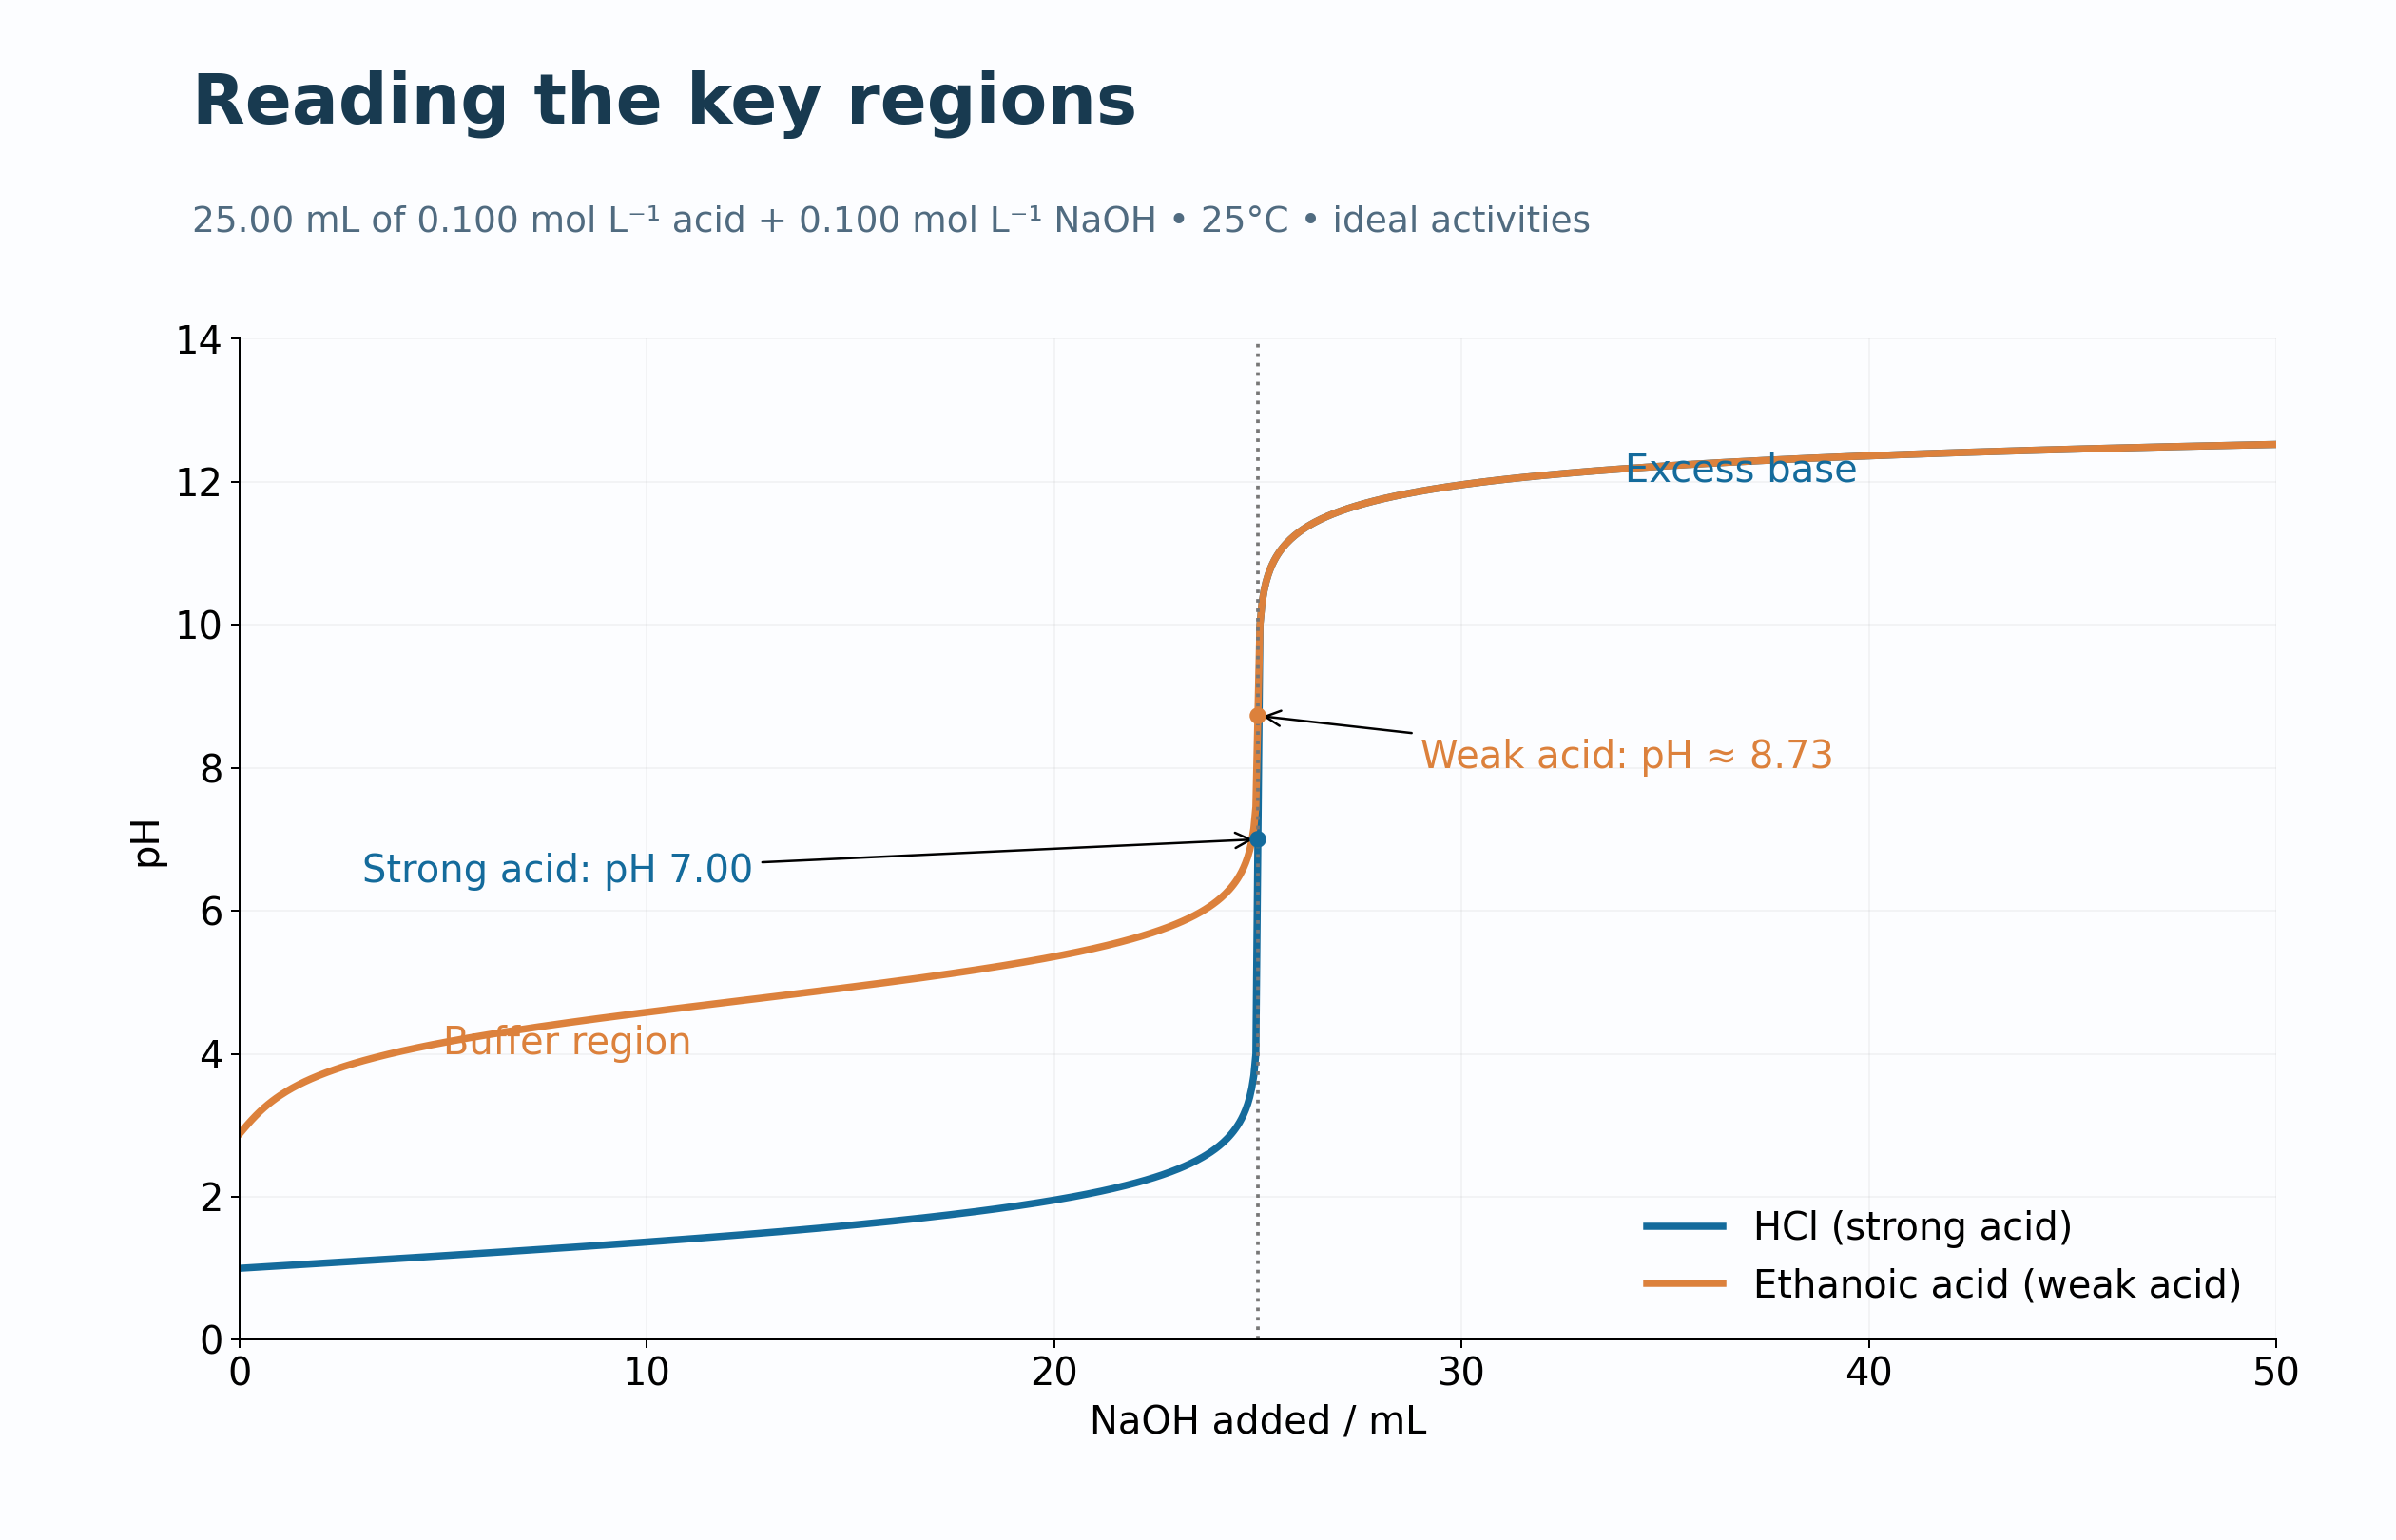
Calculated teaching model
Read the key regions
Annotations identify the buffer region, equivalence points and excess-base region.
Download original PNG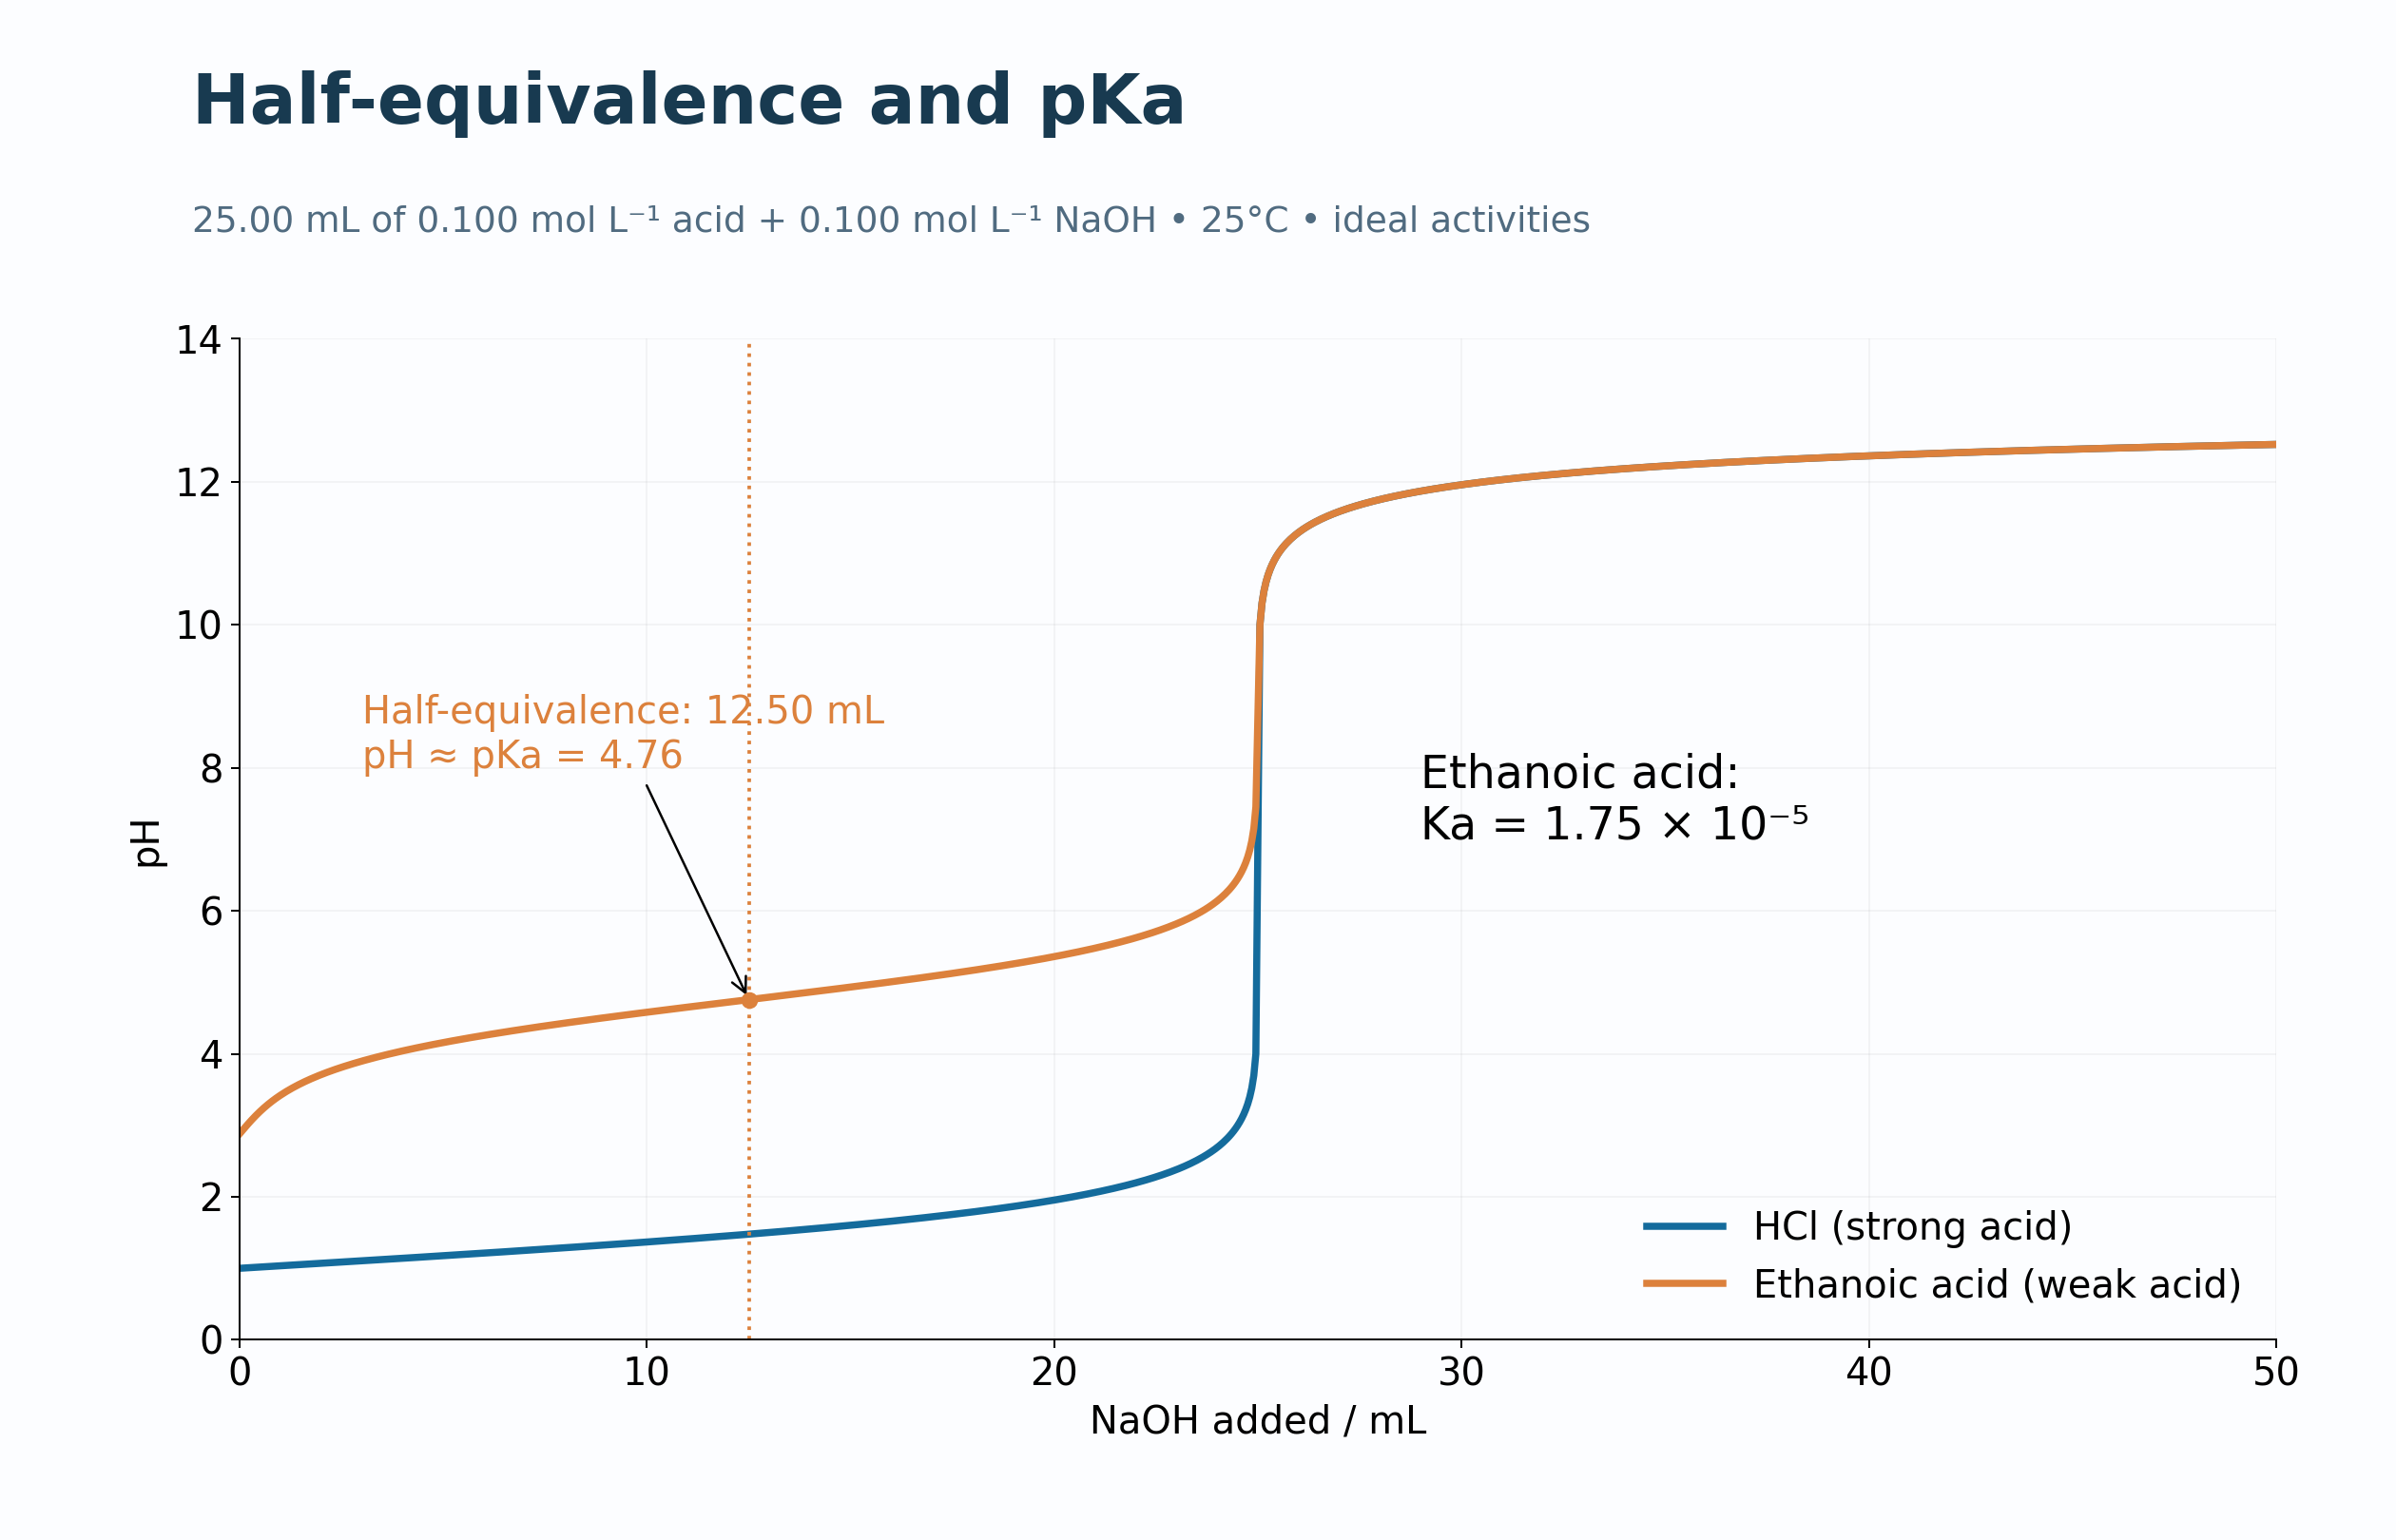
Calculated teaching model
Half-equivalence and pKa
The weak-acid curve highlights half-equivalence at 12.50 mL and pH approximately equal to pKa.
Download original PNG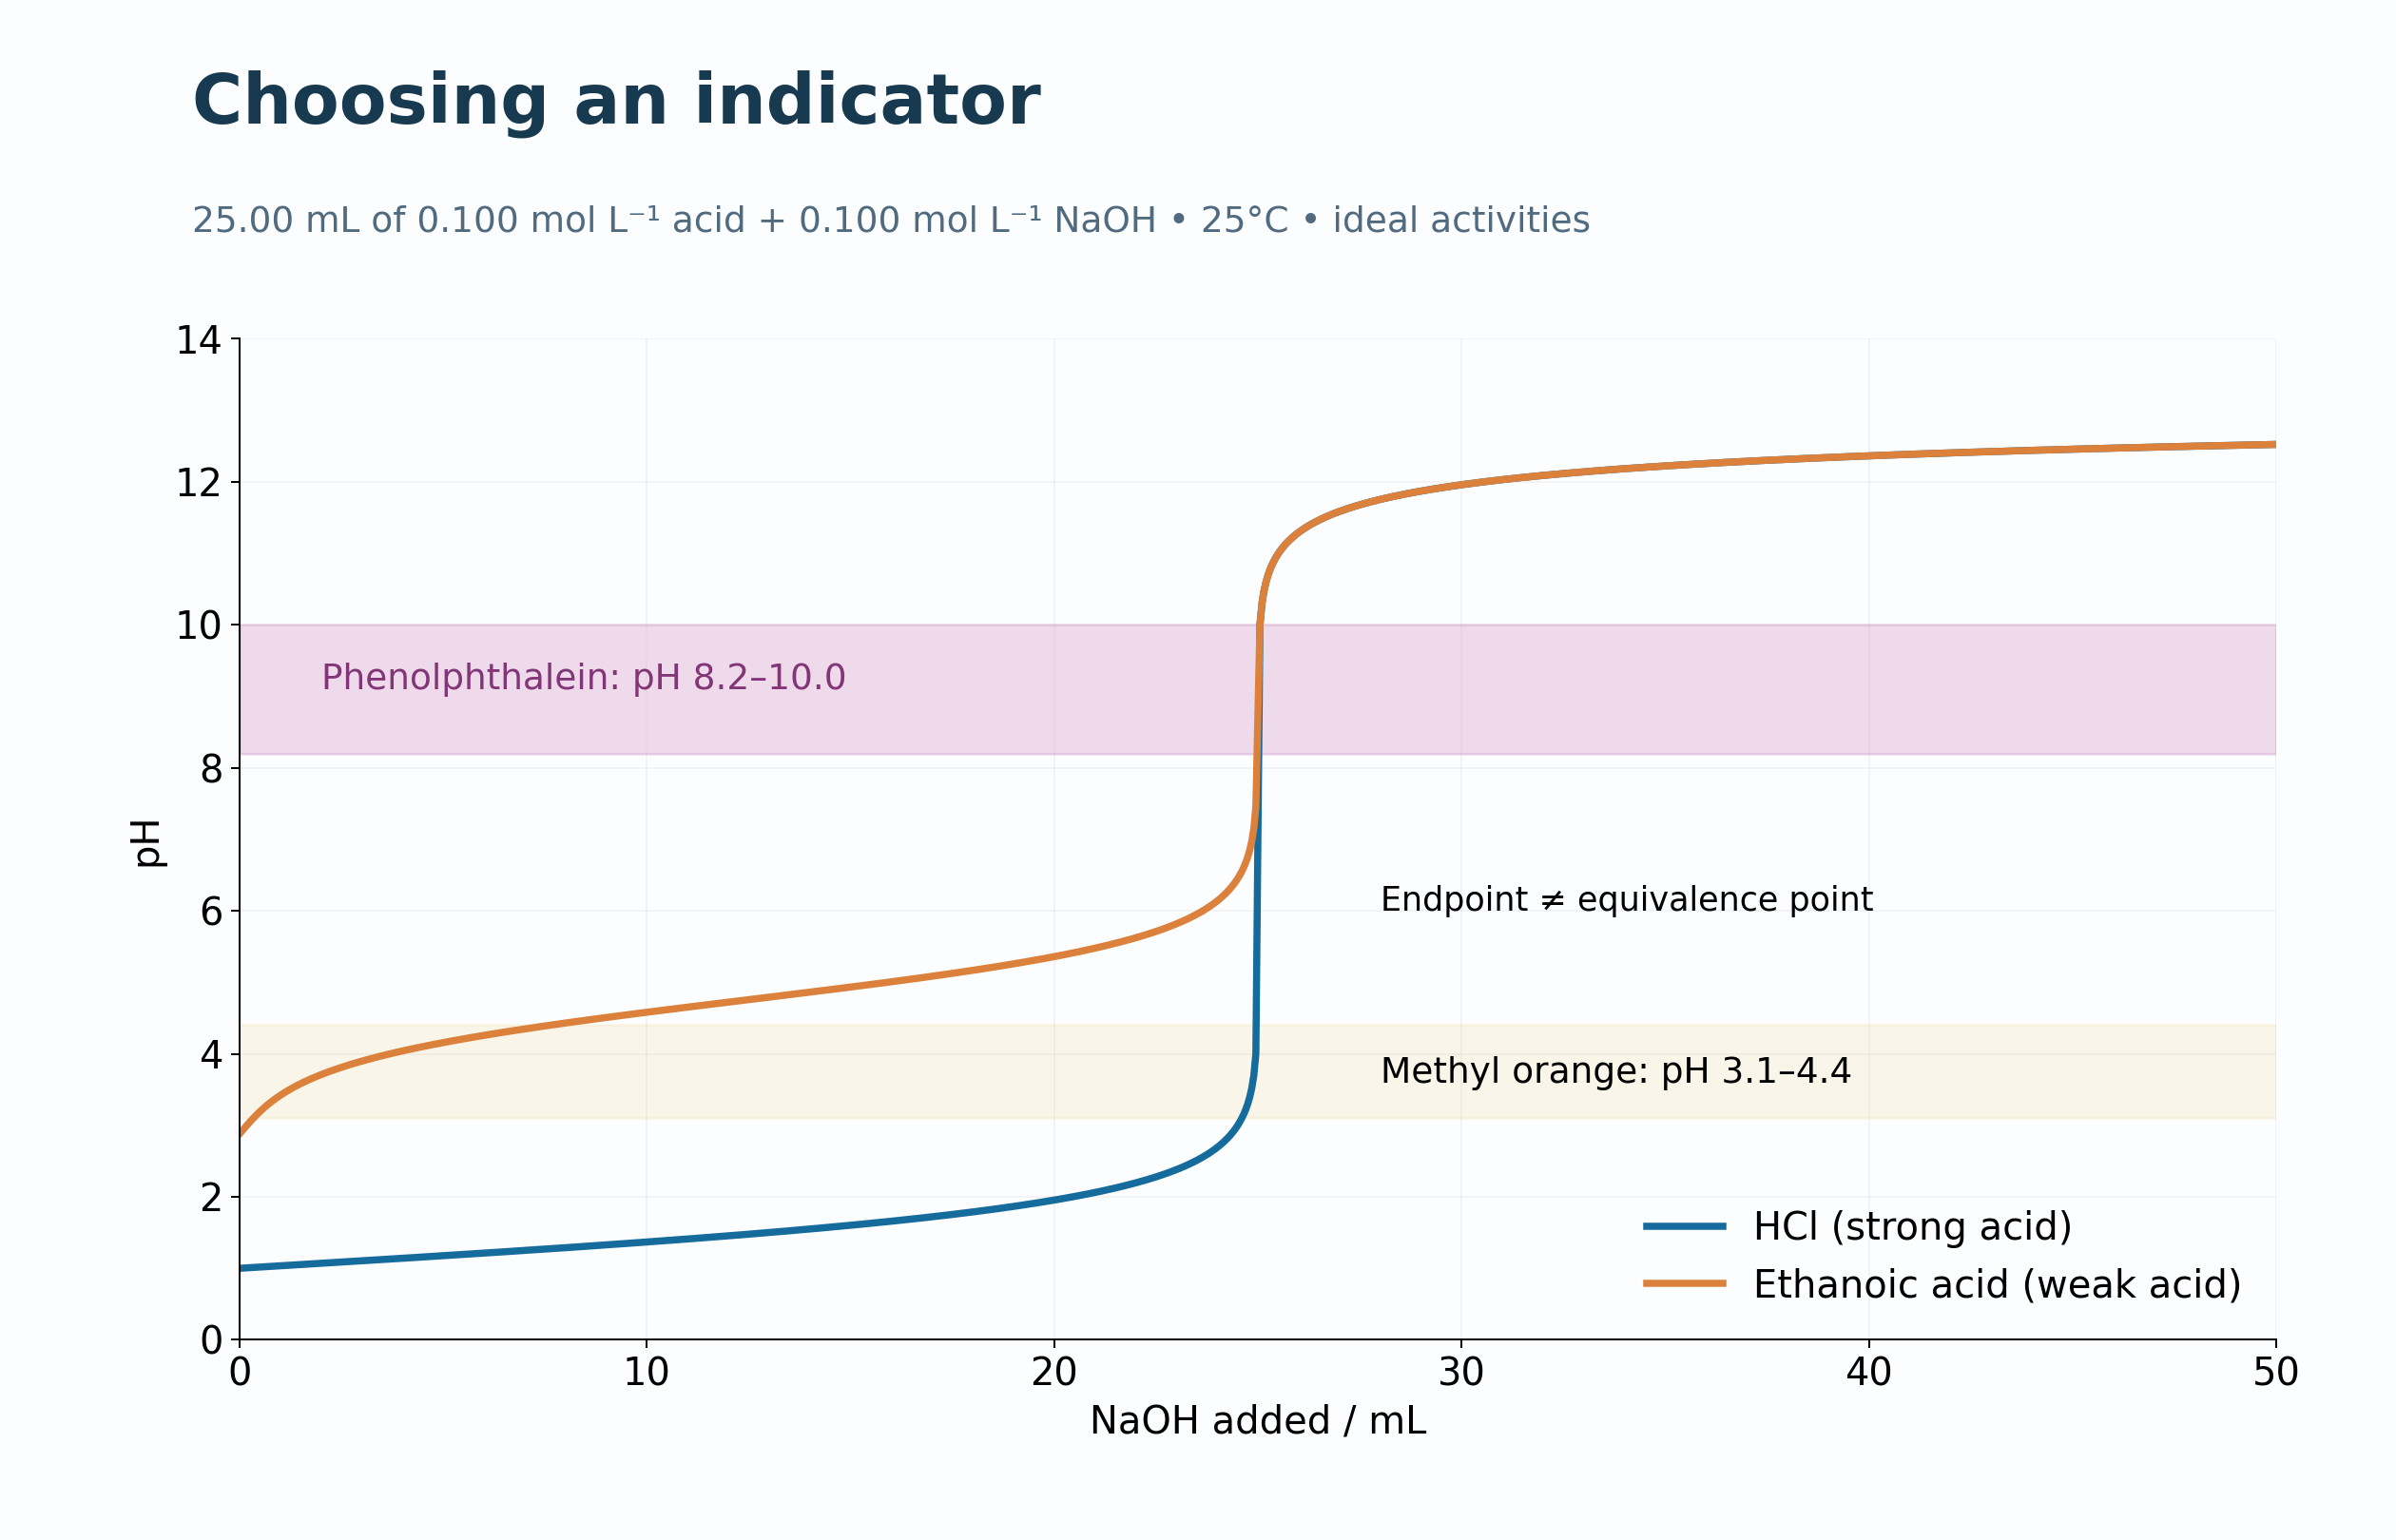
Calculated teaching model
Choose an indicator
Phenolphthalein and methyl-orange transition ranges are compared with the model titration curves.
Download original PNG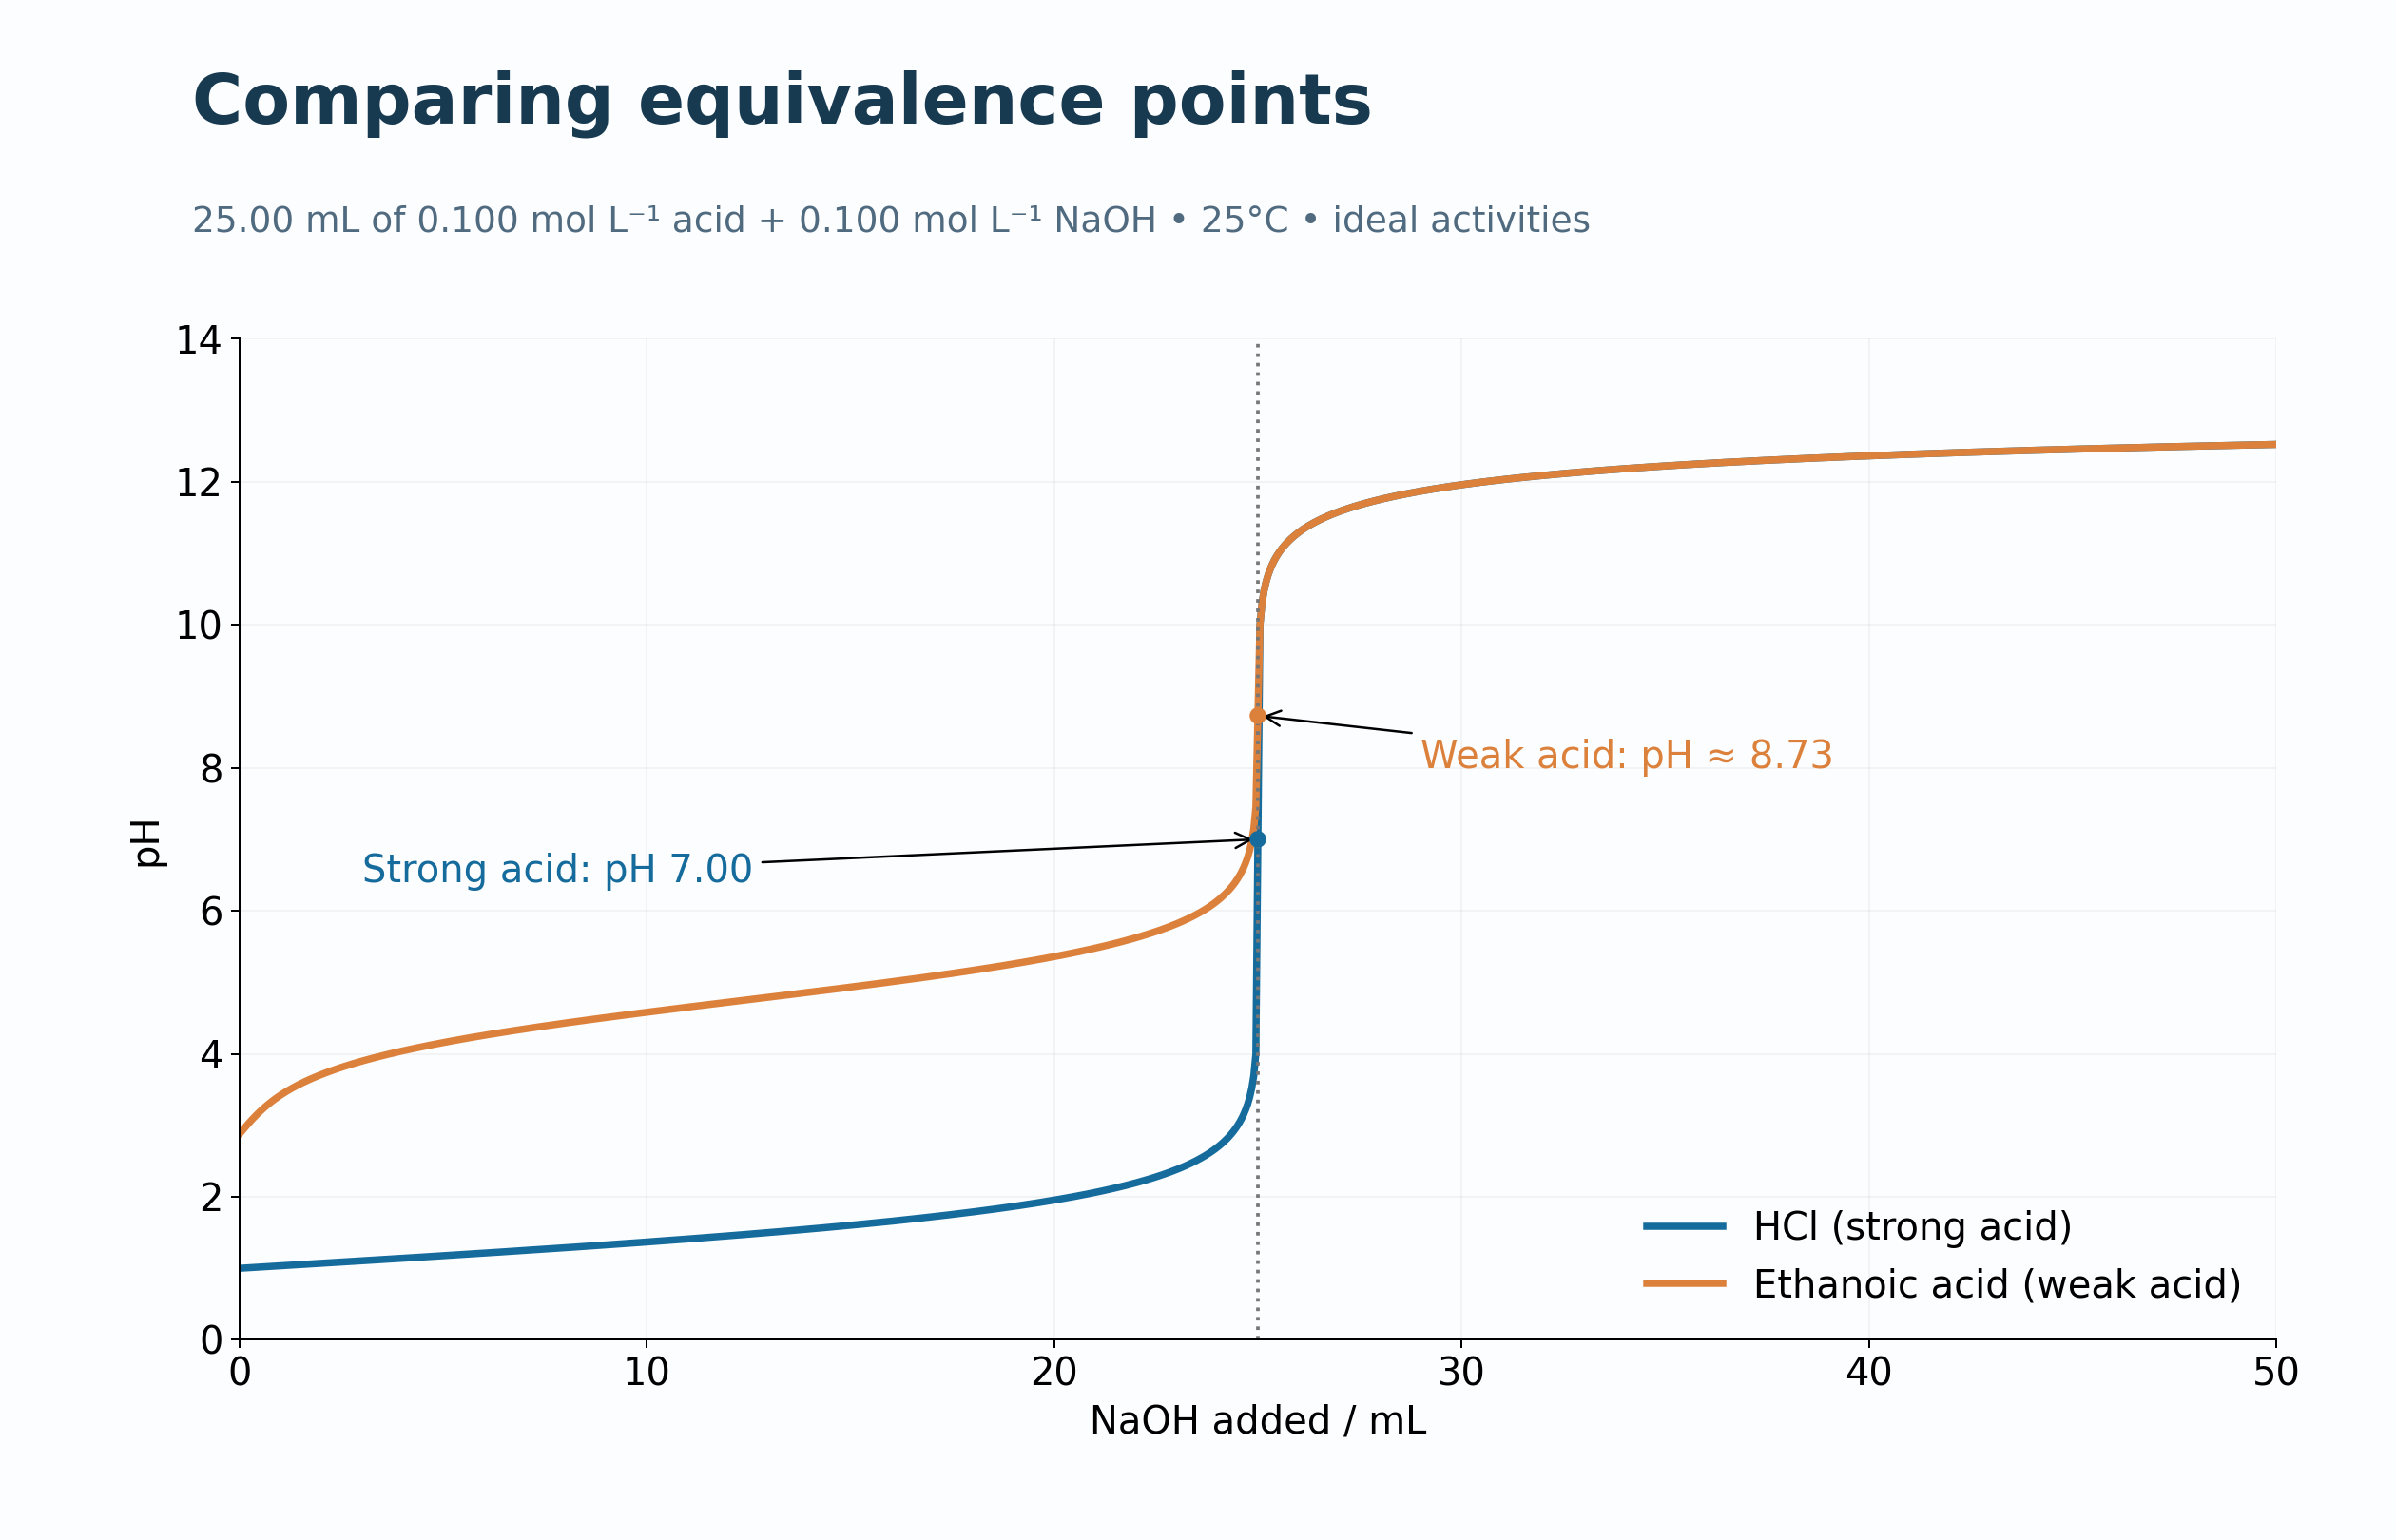
Calculated teaching model
Compare equivalence points
Strong- and weak-acid curves mark equivalence pH values near 7.00 and 8.73.
Download original PNGAbout these representations
Calculated teaching curves for 25.00 mL of 0.100 mol L−1 acid and 0.100 mol L−1 NaOH at 25°C, using ideal activities; not experimental readings.