
Follow carbon flow and reduced-carrier production through the citric acid cycle. The collection distinguishes pyruvate oxidation from the cycle and uses a GTP-forming route.
Choose from five images below. Open an image for a closer look, download its original PNG, or download all five as a ZIP.
Use these visuals in your lesson
State whether the accounting is per acetyl-CoA or per glucose before students begin. Use the comparison view to prevent outputs from pyruvate oxidation being added to cycle-only totals.
A question to discuss
Why must oxaloacetate be regenerated for the cycle to continue?
Citric acid cycle: five teaching visuals

One turn
Per acetyl-CoA: two CO2, three NADH, one FADH2 equivalent and one GTP.
Download original PNG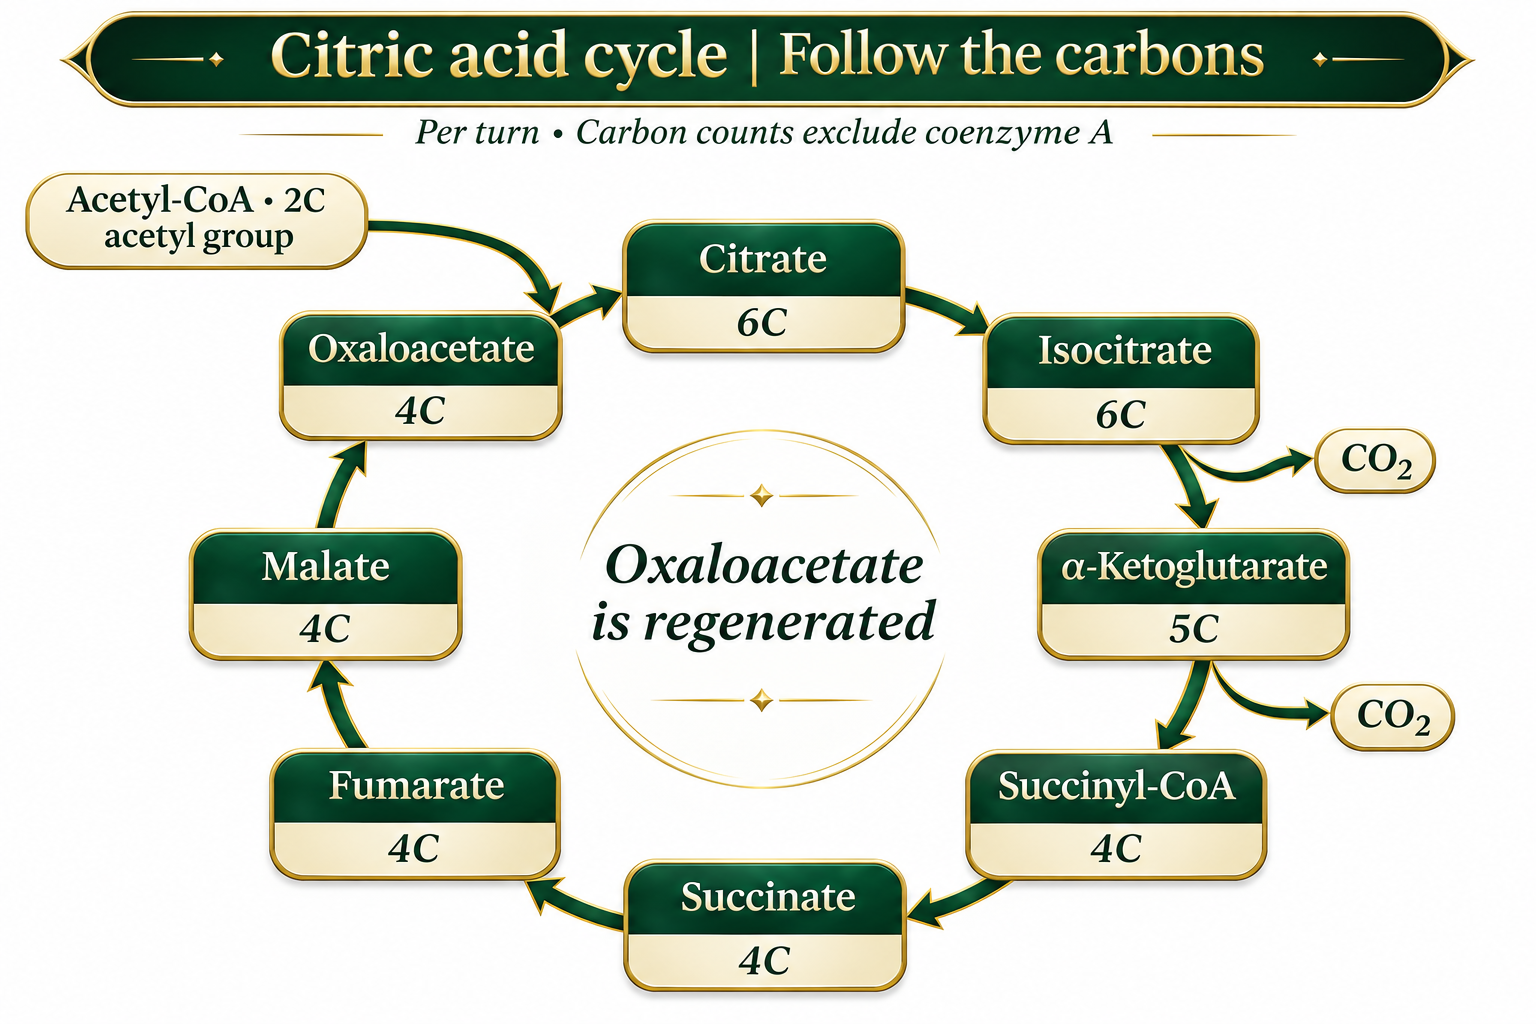
Follow the carbons
Track carbon counts through cycle intermediates and oxaloacetate regeneration.
Download original PNG
Where carriers form
Carrier-forming reactions, including reduction of enzyme-bound FAD at succinate dehydrogenase.
Download original PNG
The link reaction
Distinguish pyruvate oxidation from the citric acid cycle that follows.
Download original PNG
One turn or two?
Compare cycle-only outputs per acetyl-CoA and per glucose; the illustrated route produces GTP.
Download original PNG