
Use gel diagrams to interpret DNA separation and compare band patterns. These teaching visuals support reasoning about fragment movement without treating a schematic as a measured experimental result.
Choose from five images below. Open an image for a closer look, download its original PNG, or download all five as a ZIP.
Use these visuals in your lesson
Identify the wells, movement direction and reference lane before interpreting bands. Ask students to distinguish a band's position from its intensity.
A question to discuss
What can a reference ladder help you infer about an unknown DNA fragment?
Gel electrophoresis: five teaching visuals

DNA moves toward positive
Negatively charged DNA migrates toward the positive electrode; smaller fragments travel farther.
Download original PNG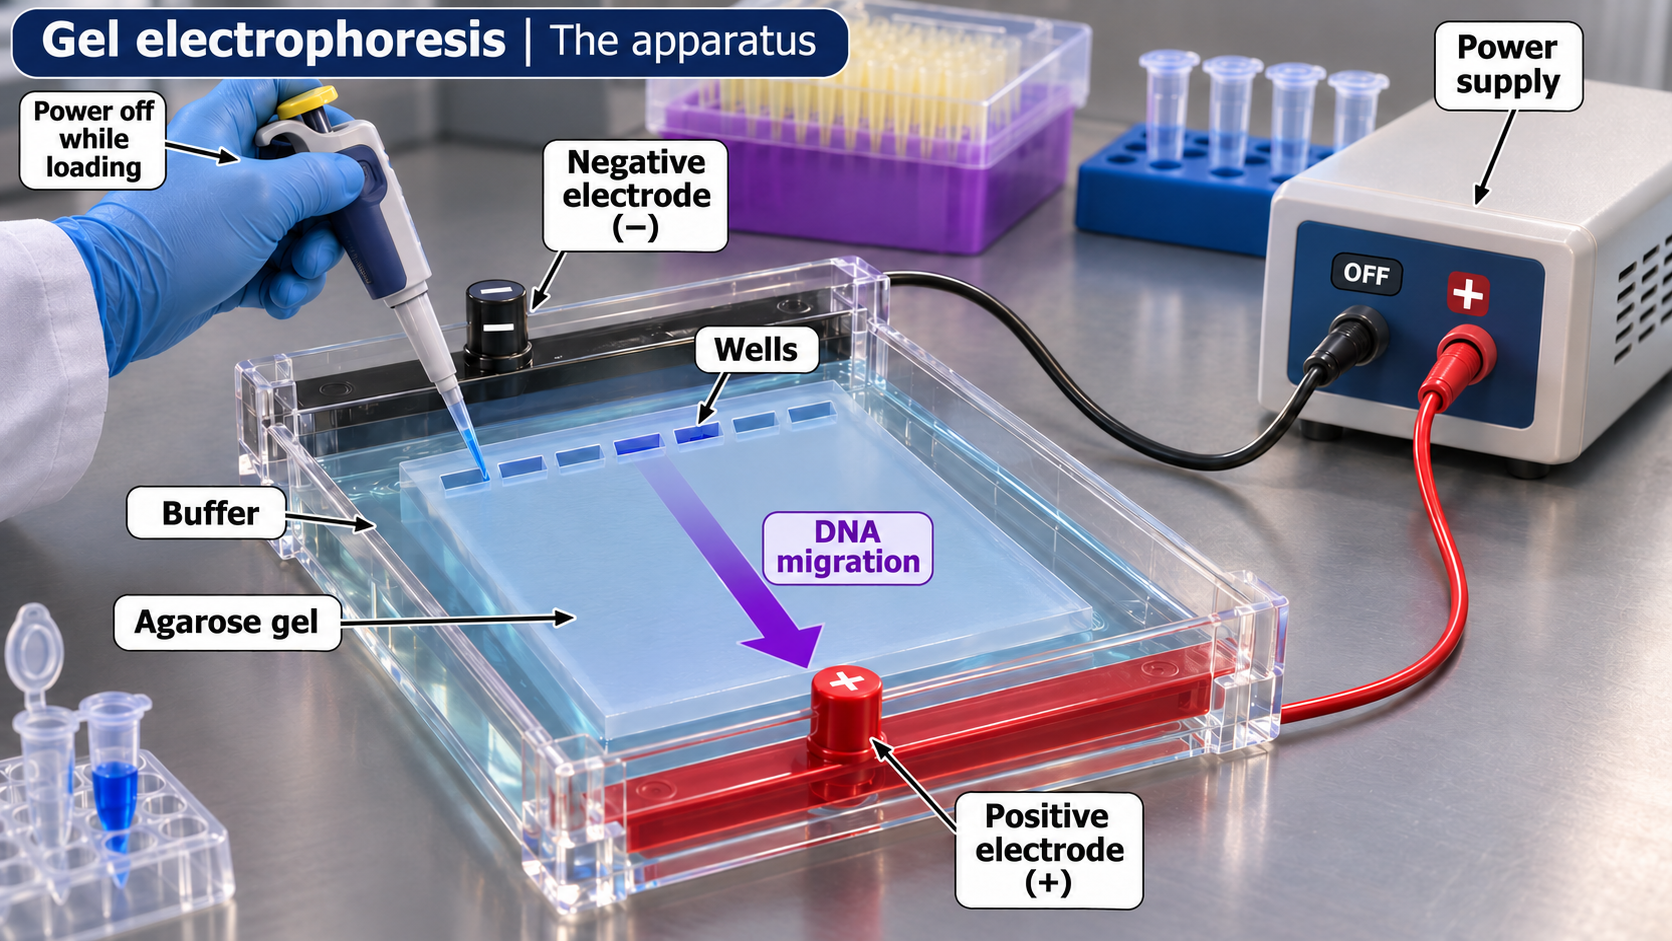
The apparatus
A labelled agarose-gel setup shows wells, buffer, electrodes and the direction of DNA migration.
Download original PNG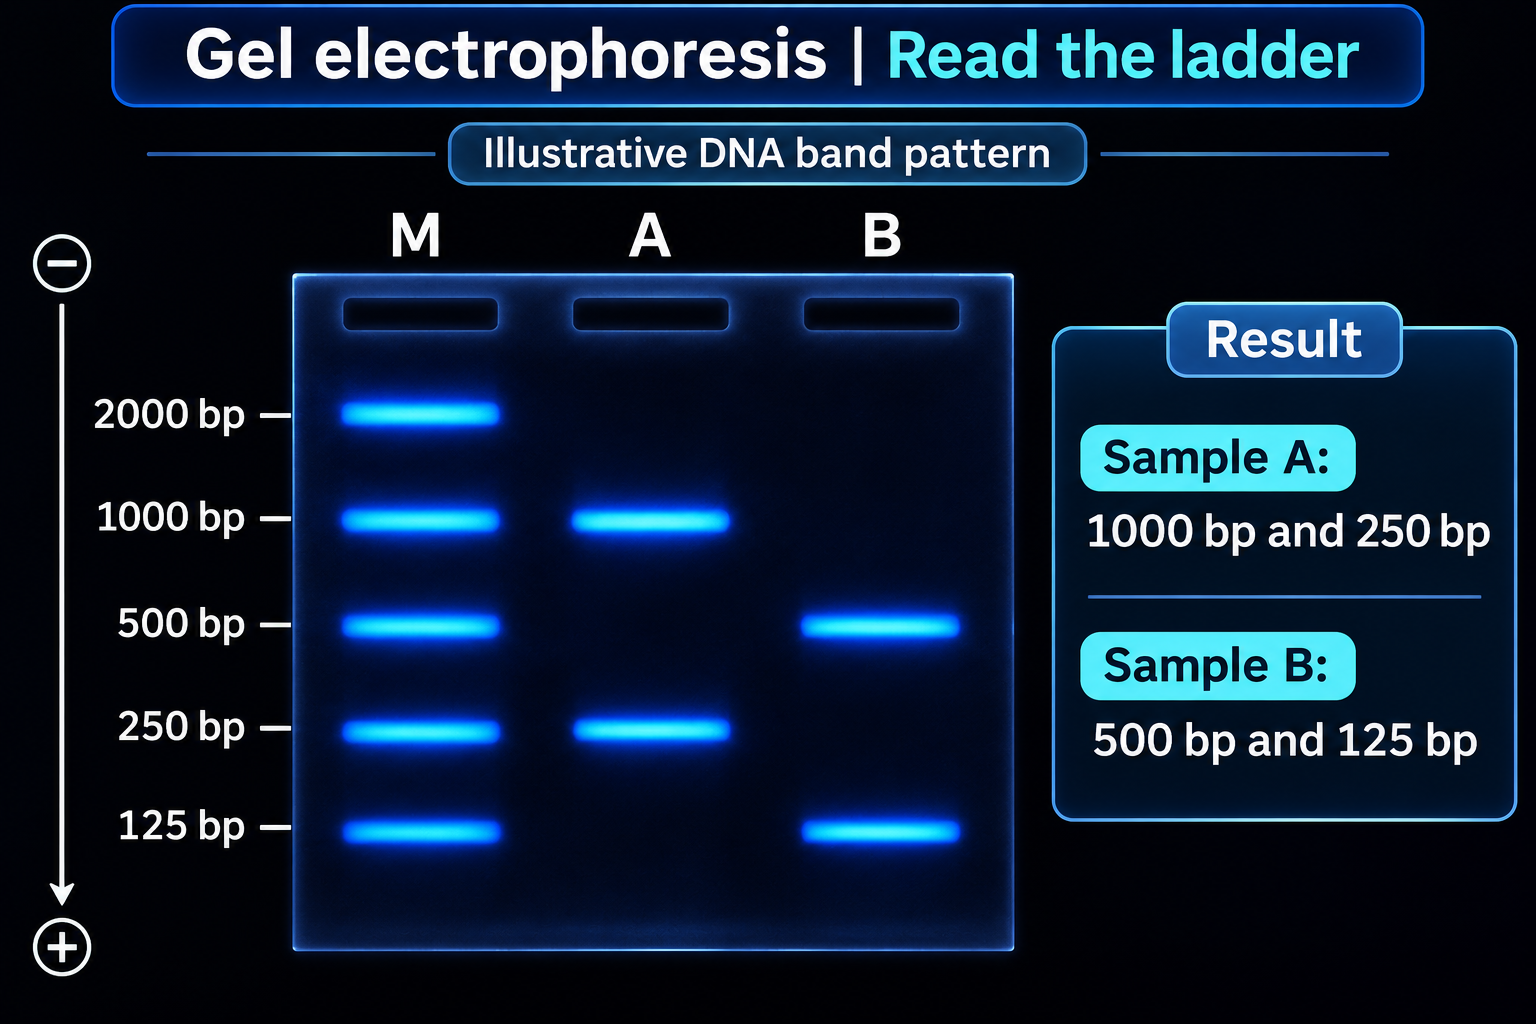
Read the ladder
An illustrative band pattern compares sample fragments with a labelled DNA size ladder.
Download original PNG
Estimate fragment size
An illustrative semilog calibration estimates a 25 mm band at approximately 707 base pairs.
Download original PNG
Same size, different sequence
Equal migration can suggest similar fragment length without establishing identical DNA sequences.
Download original PNG