
Explore how an immune response can change after previous exposure. The collection supports discussion of memory cells and the differences between primary and subsequent responses.
Choose from five images below. Open an image for a closer look, download its original PNG, or download all five as a ZIP.
Use these visuals in your lesson
Ask students to compare response timing as well as magnitude. Distinguish an explanatory teaching graph from measurements collected in a particular experiment.
A question to discuss
How can memory cells contribute to a faster response on later exposure?
Immune memory: five teaching visuals
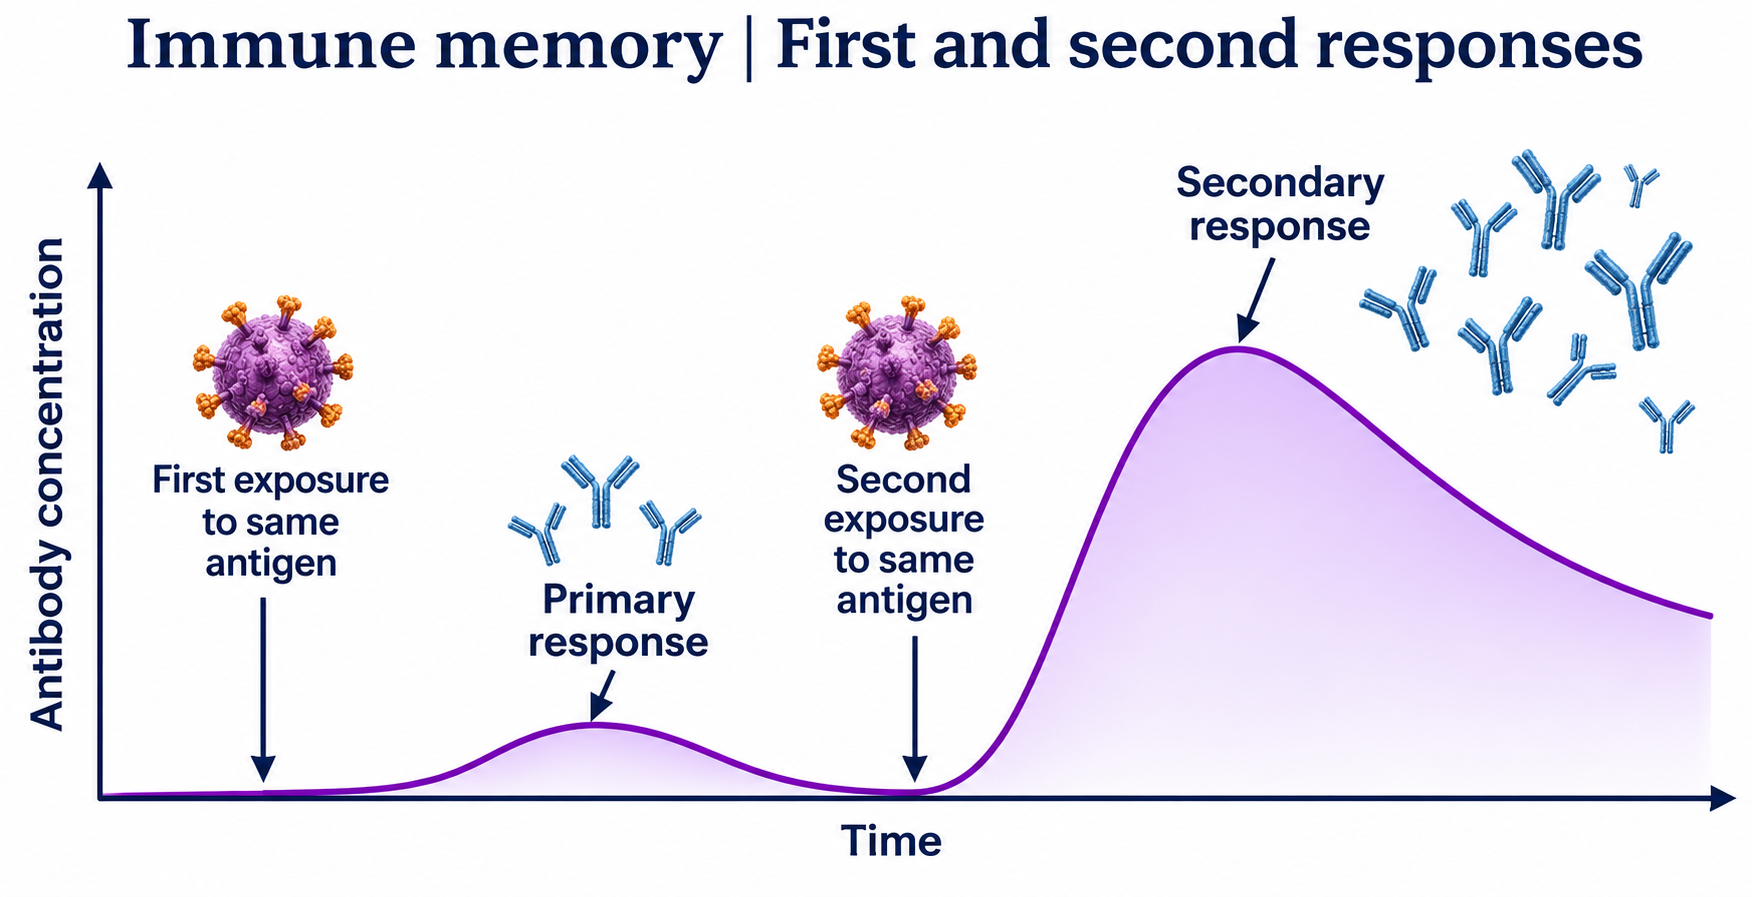
First and second responses
A qualitative antibody-response curve compares first and repeated exposure to the same antigen.
Download original PNG
Why the second response is faster
B-cell expansion, plasma cells and memory cells explain a faster response after later exposure.
Download original PNG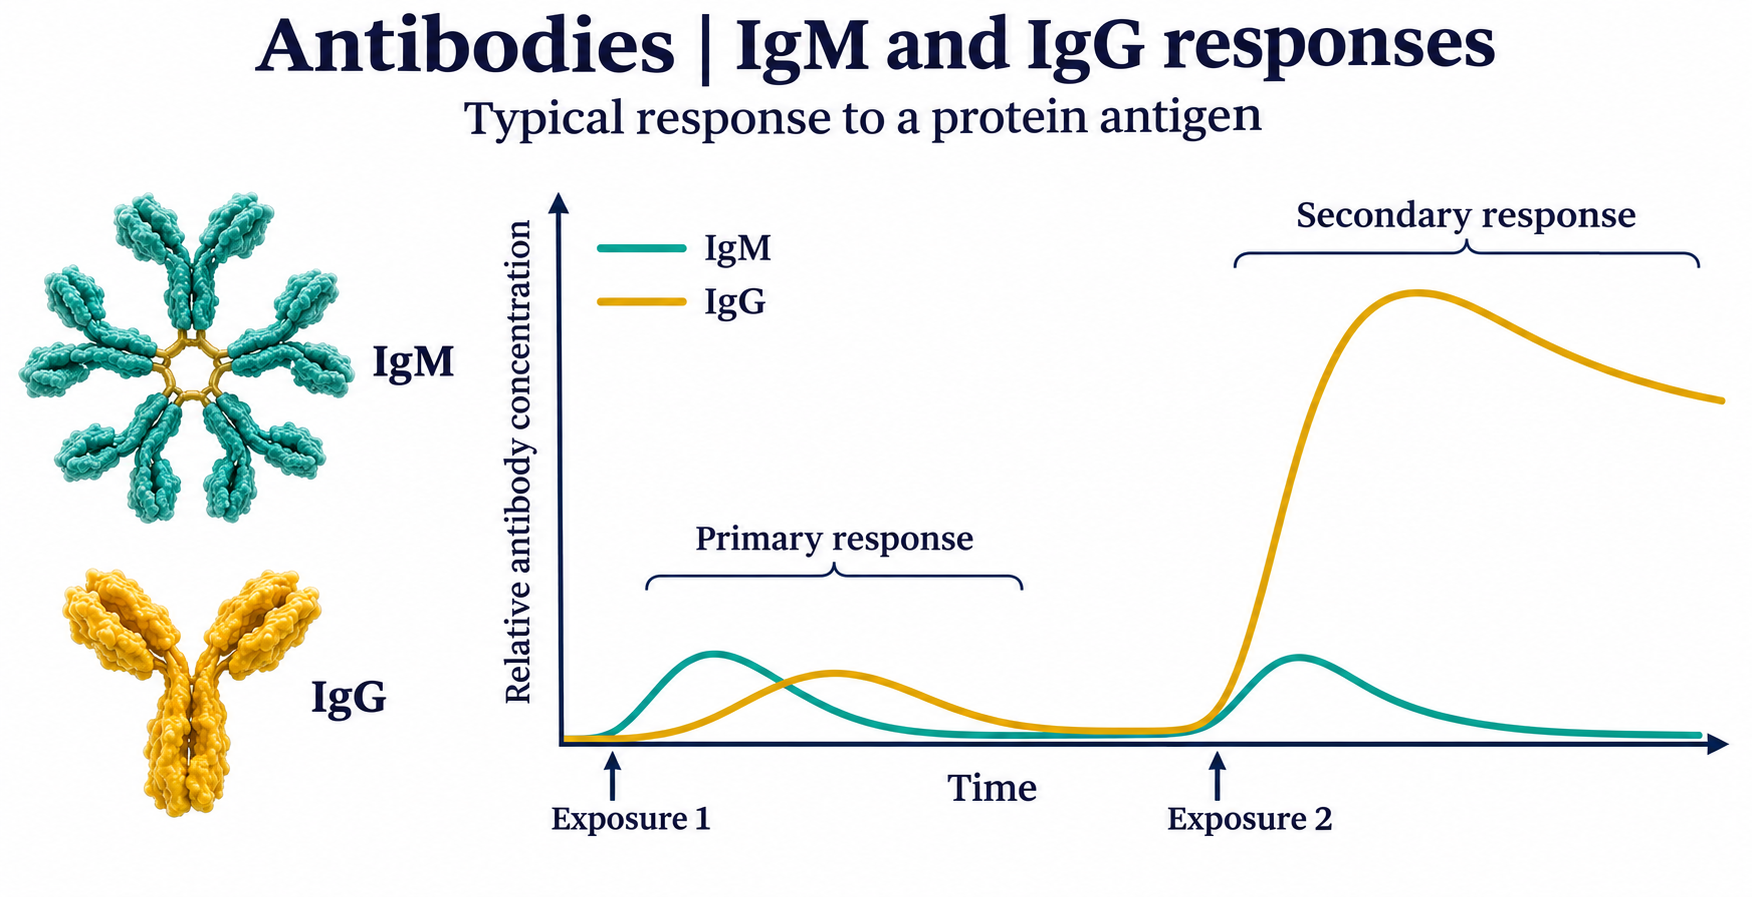
IgM and IgG responses
Qualitative curves compare typical IgM and IgG responses to repeated exposure to a protein antigen.
Download original PNG
Vaccination and memory
A simplified adaptive response shows a first vaccine dose, persistent memory cells and a booster.
Download original PNG
Specific to the antigen
A qualitative comparison shows memory for antigen A alongside a first response to antigen B.
Download original PNG