
Use an Aa × Aa cross to explore allele combinations and probability under a complete-dominance model. The images support the distinction between genotype and phenotype.
Choose from five images below. Open an image for a closer look, download its original PNG, or download all five as a ZIP.
Use these visuals in your lesson
Ask students to identify the gametes before filling a cross. Discuss the results as probabilities for each offspring, not a fixed sequence that a family must follow.
A question to discuss
Why can two offspring with the same phenotype have different genotypes?
Monohybrid inheritance: five teaching visuals
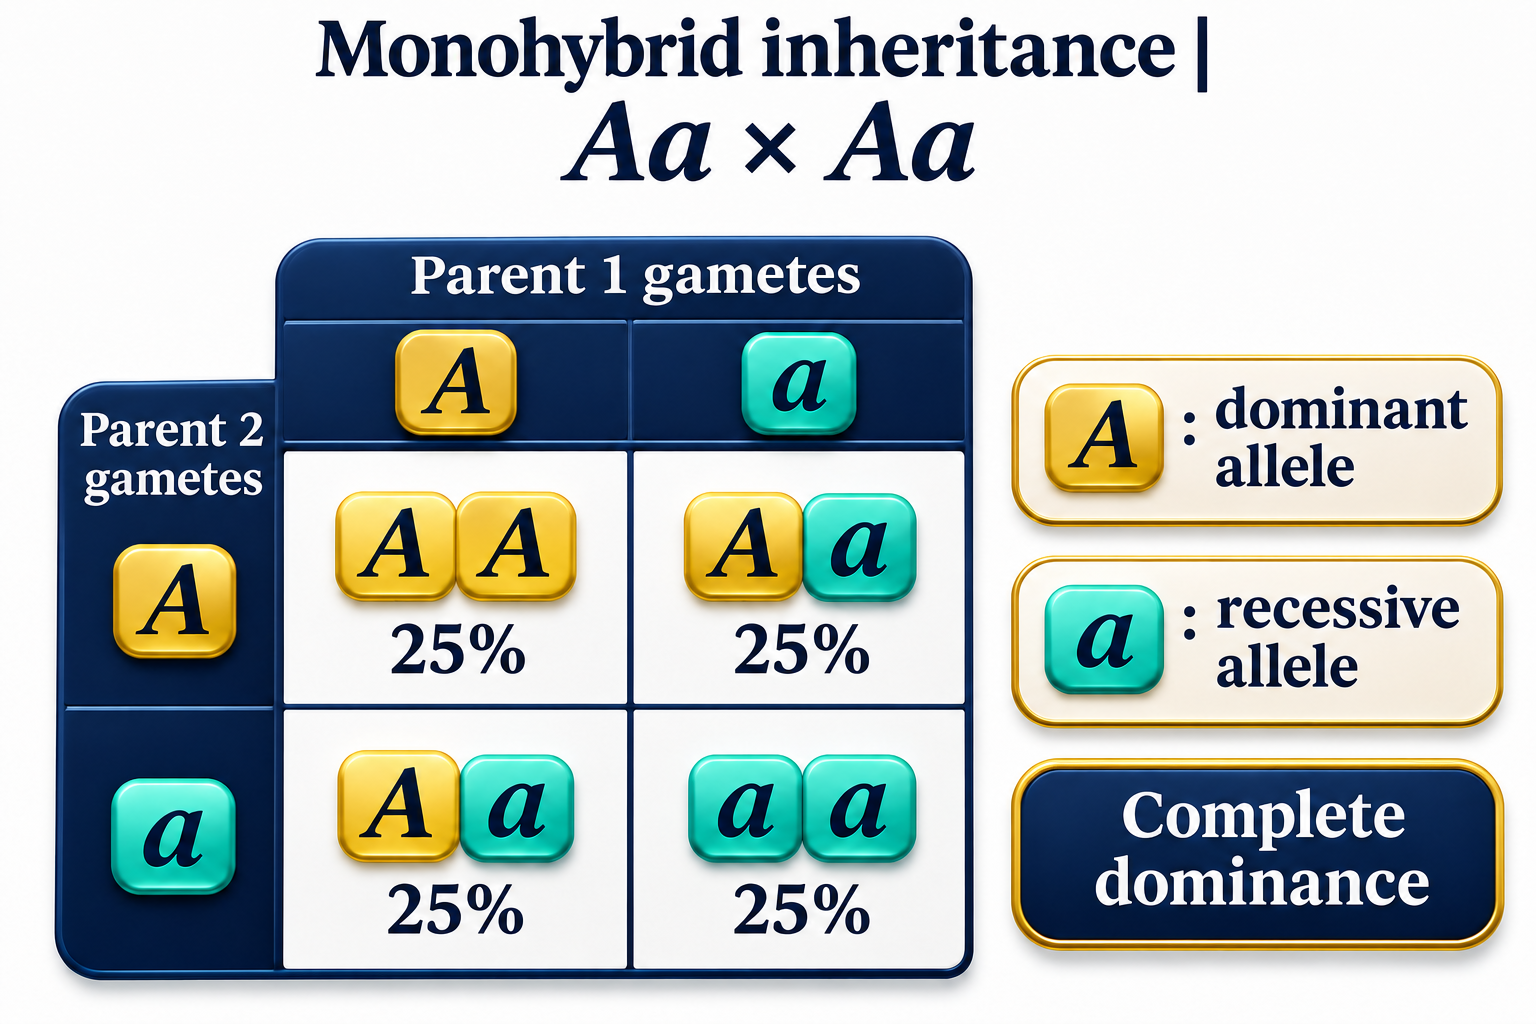
A Punnett square
Four equally likely combinations give AA, Aa, Aa and aa.
Download original PNG
From parents to gametes
Each heterozygous parent contributes either allele with probability one half.
Download original PNG
Two independent contributions
A probability tree combines the two parental allele contributions.
Download original PNG
Genotype and phenotype
Expected genotype and phenotype probabilities under complete dominance.
Download original PNG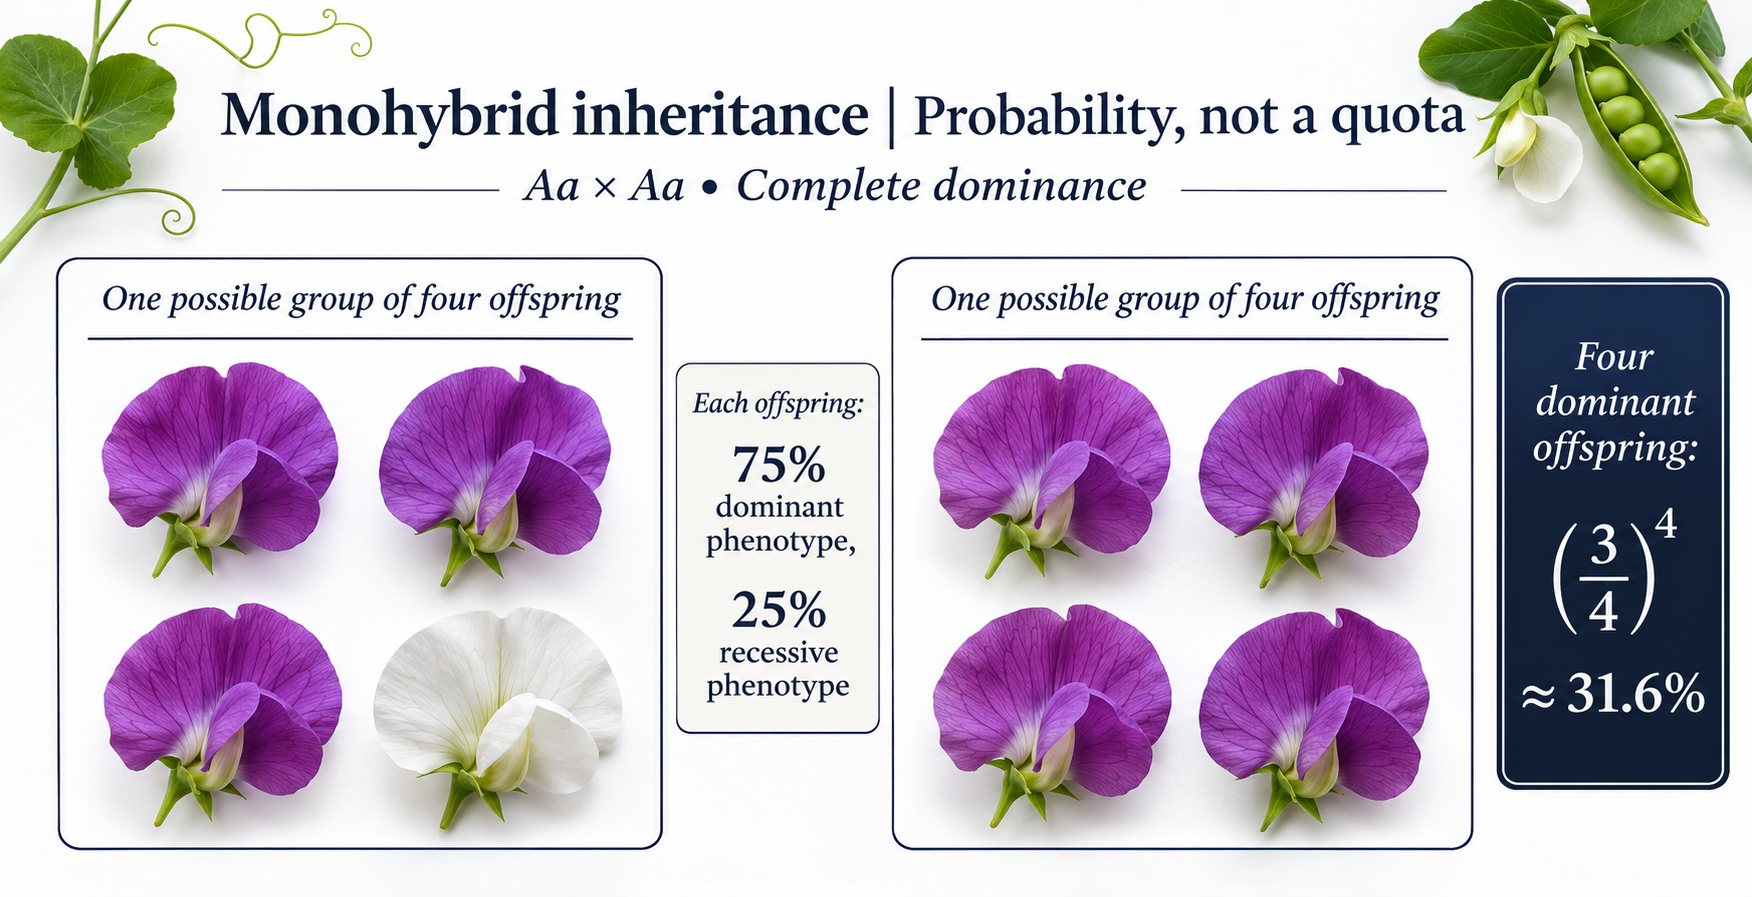
Probability, not a quota
Possible groups of four offspring show why a 3:1 ratio is not a guaranteed result.
Download original PNG