
Make water movement visible through solution diagrams, a water-channel view and red blood cell comparisons. The set also introduces the role of pressure in water potential.
Choose from five images below. Open an image for a closer look, download its original PNG, or download all five as a ZIP.
Use these visuals in your lesson
Use the initial and later solution levels for a prediction before revealing the outcome. Keep the discussion focused on water movement and membrane permeability.
A question to discuss
What changes when pressure balances the tendency for net water movement?
Osmosis: five teaching visuals
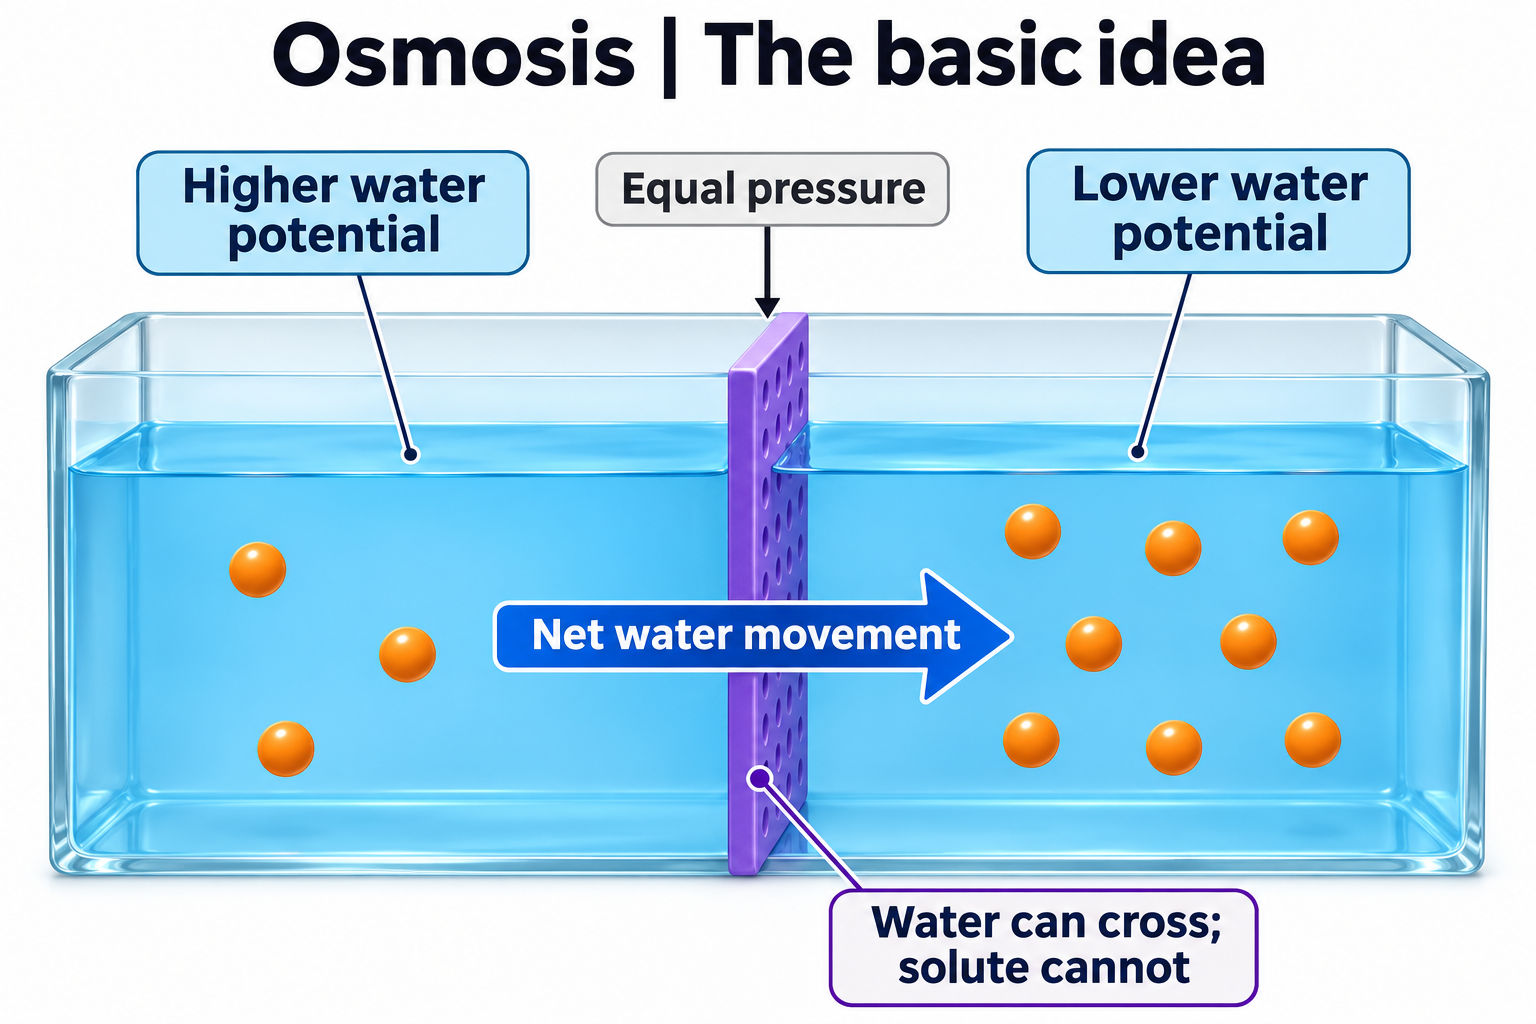
The basic idea
Introduce net water movement across a selectively permeable membrane.
Download original PNG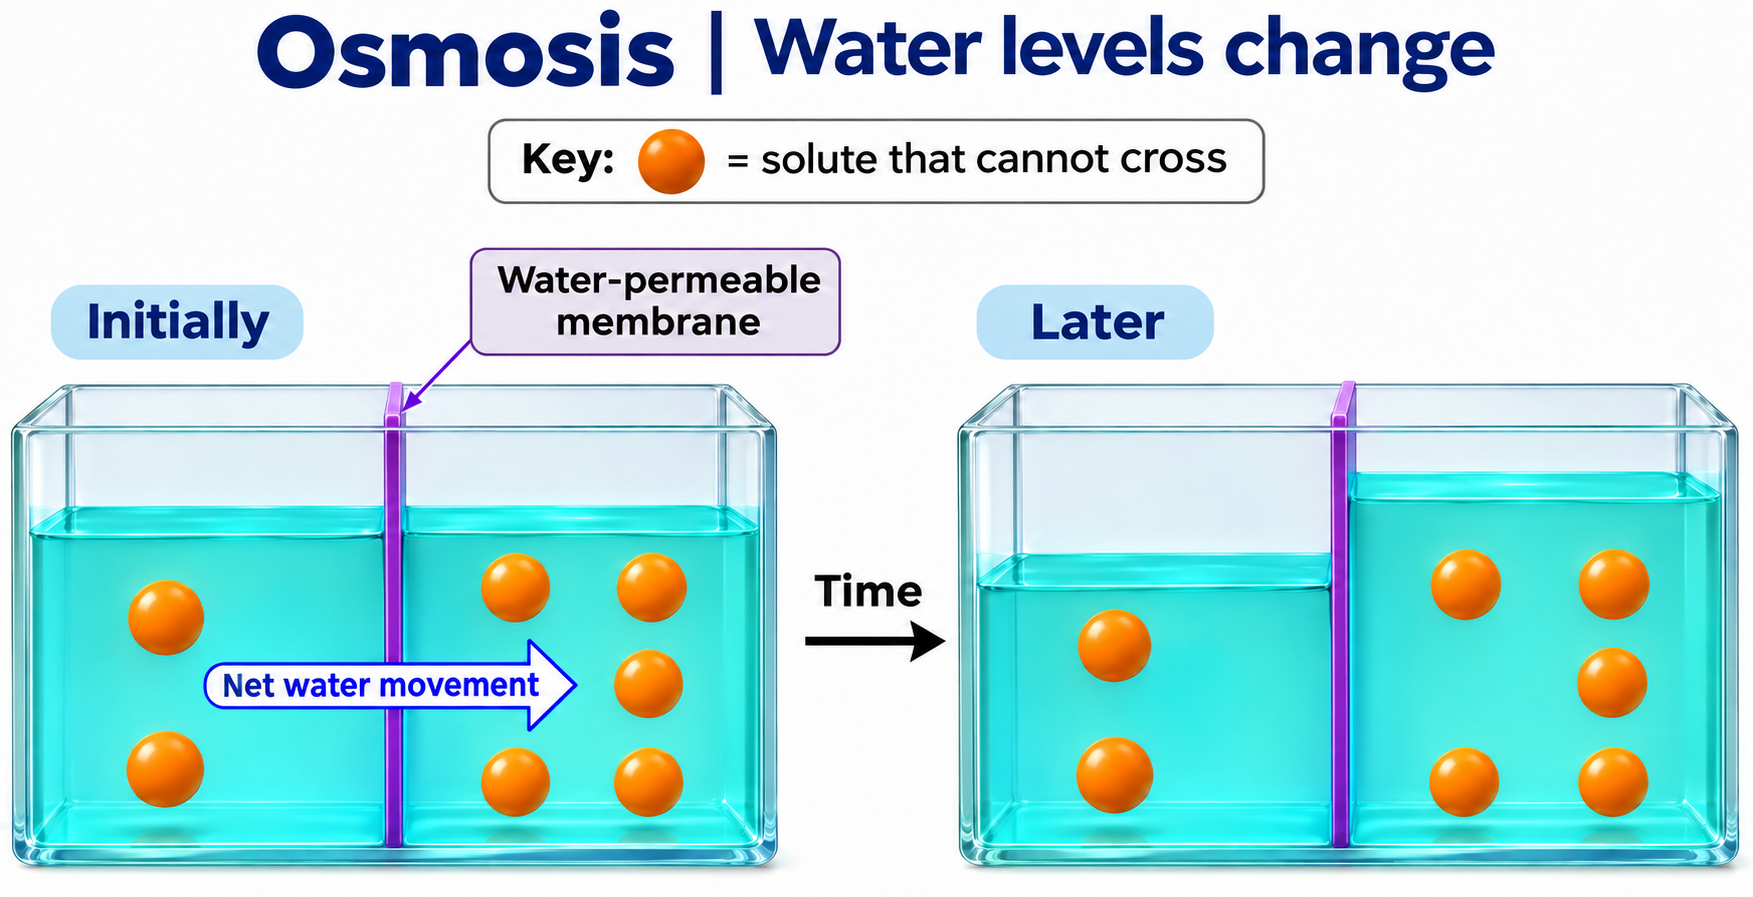
Water levels change
Compare initial water levels with the levels after net water movement.
Download original PNG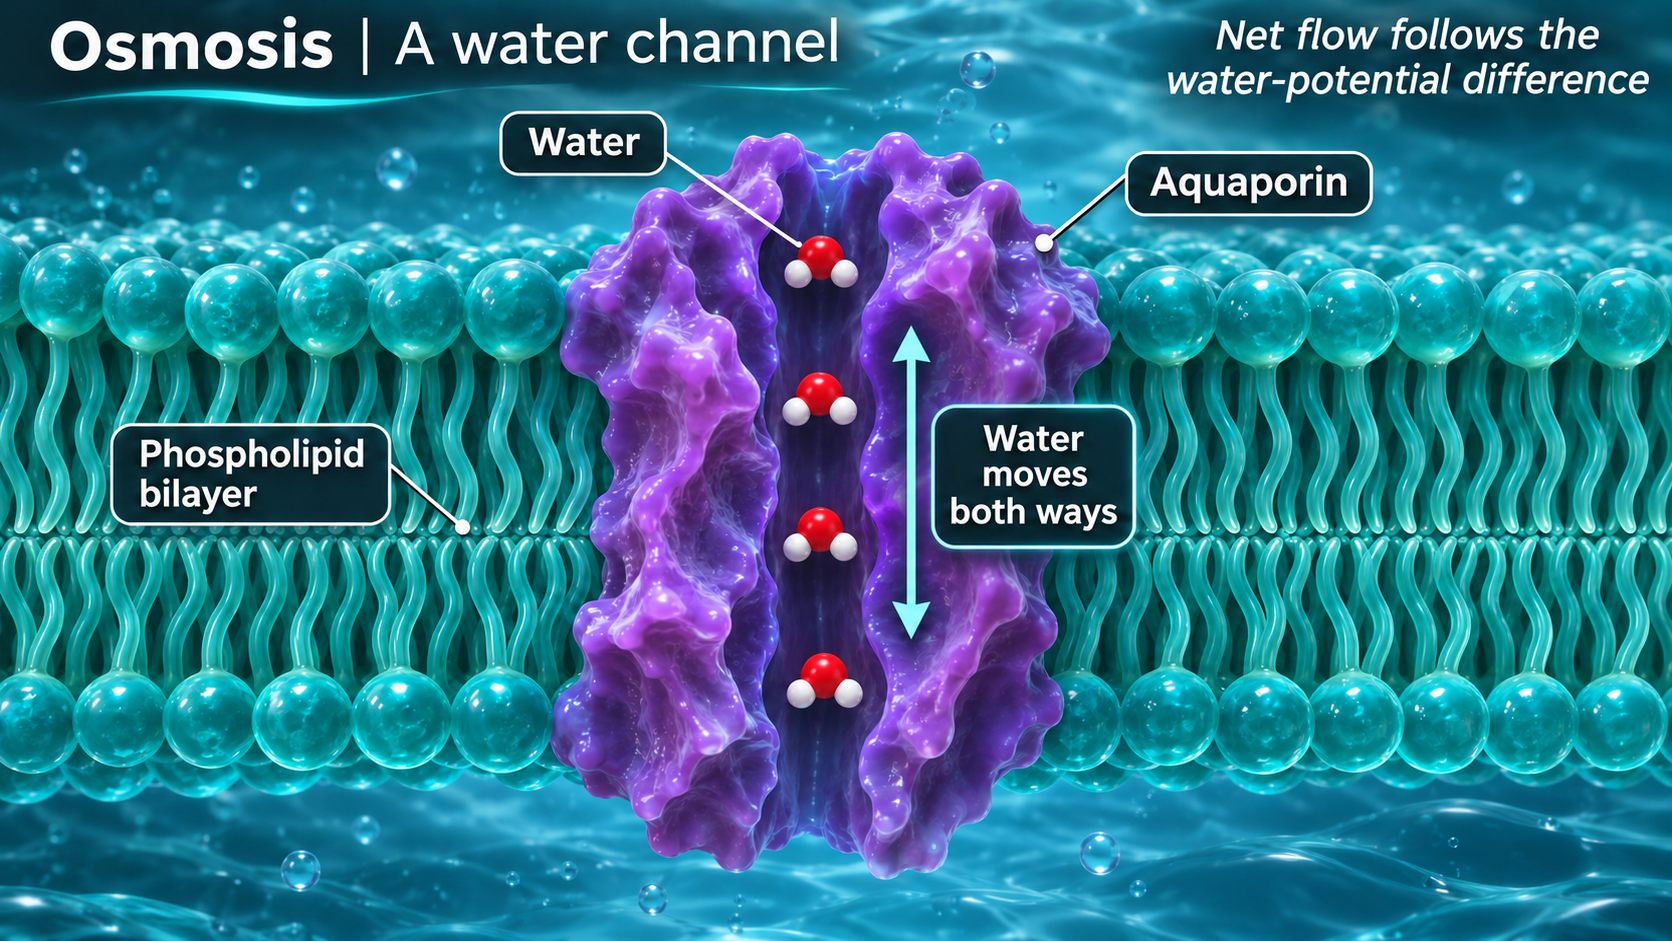
Through a water channel
Explore water movement through a membrane channel.
Download original PNG
Pressure matters
Use the example values to discuss pressure and solute potential at equilibrium.
Download original PNG
Red blood cells
Compare red blood cells in solutions with different tonicities.
Download original PNG