
Compare population growth patterns and the role of limiting factors. The teaching graphs support interpretation of models rather than a claim that real populations follow a perfect curve.
Choose from five images below. Open an image for a closer look, download its original PNG, or download all five as a ZIP.
Use these visuals in your lesson
Read both axes and identify the model assumptions. Ask students to suggest how changing resources or conditions could alter the pattern shown.
A question to discuss
Why is carrying capacity better understood as dependent on conditions than as a permanent fixed number?
Population growth and carrying capacity: five teaching visuals
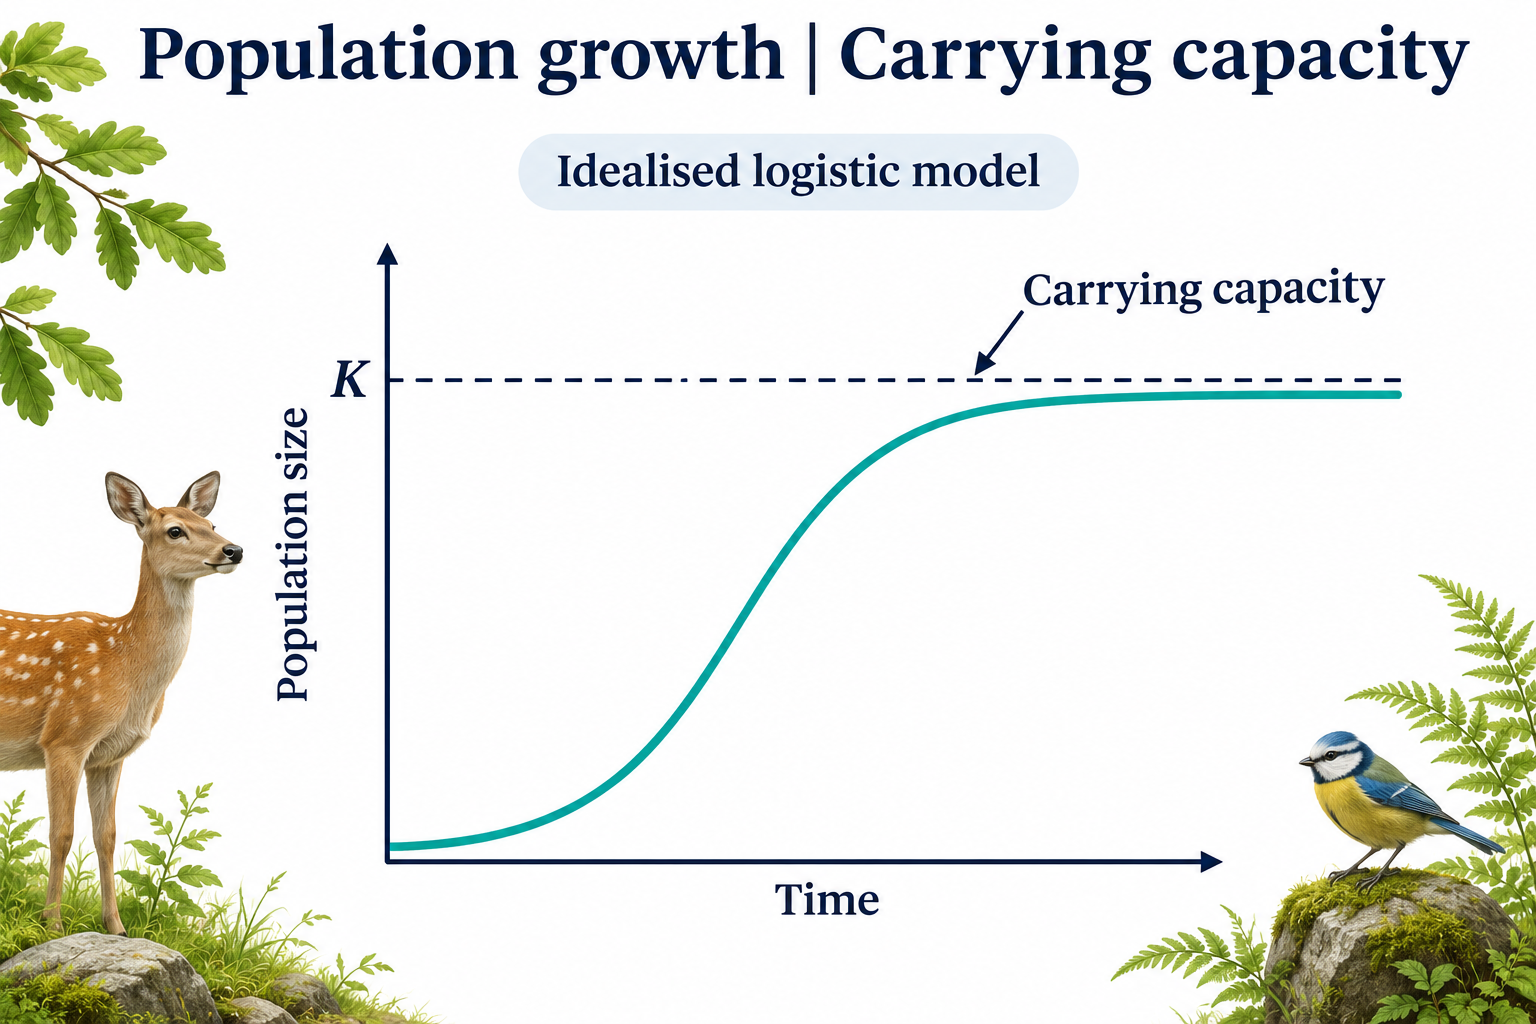
Carrying capacity
An idealised logistic curve approaches carrying capacity K.
Download original PNG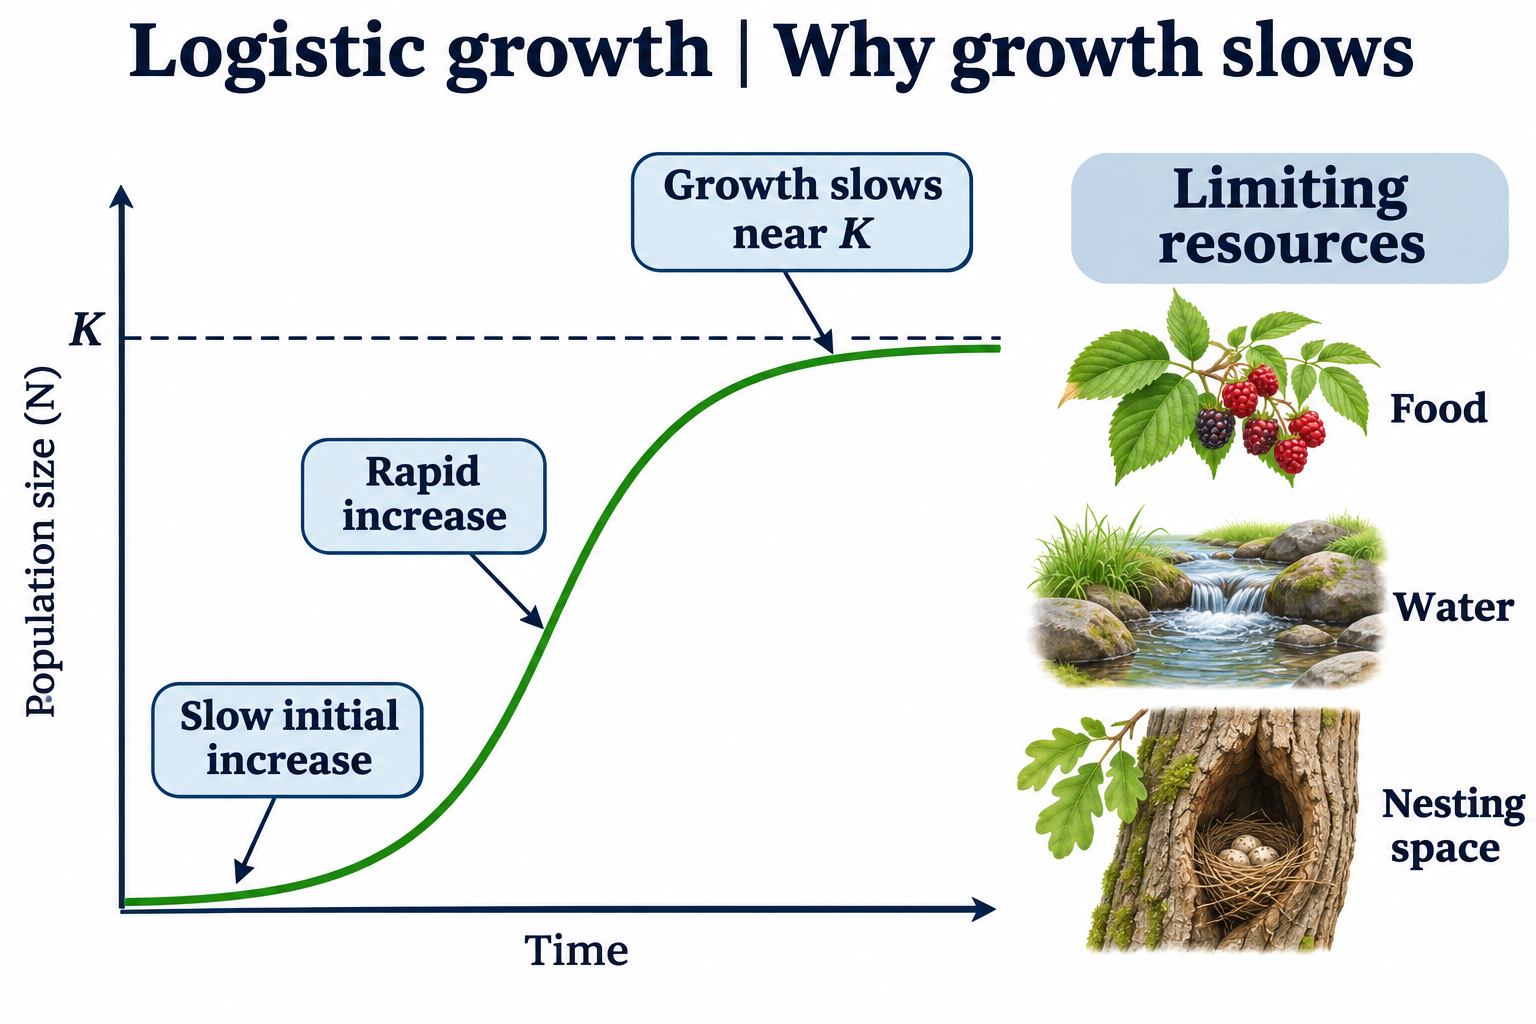
Why growth slows
Food, water and nesting space illustrate resources that can limit population growth.
Download original PNG
Exponential or logistic?
Idealised curves compare exponential and logistic growth from the same starting population.
Download original PNG
When resources are lost
A conceptual model shows a population declining toward a lower carrying capacity after resource loss.
Download original PNG
Density dependence
Illustrative birth and death rates are compared below and near carrying capacity.
Download original PNG