
Use test crosses to investigate an unknown genotype under a simple inheritance model. The diagrams make the known tester and possible gametes visible.
Choose from five images below. Open an image for a closer look, download its original PNG, or download all five as a ZIP.
Use these visuals in your lesson
Ask students to predict the possible offspring from each candidate genotype before interpreting observed offspring. Discuss why sample size matters when drawing conclusions.
A question to discuss
Why is a homozygous recessive individual useful in a test cross?
Test crosses: five teaching visuals

The unknown genotype
Crossing a dominant-phenotype parent with an aa tester distinguishes possible AA and Aa parents.
Download original PNG
Compare the possibilities
Punnett squares compare the expected offspring of AA × aa and Aa × aa.
Download original PNG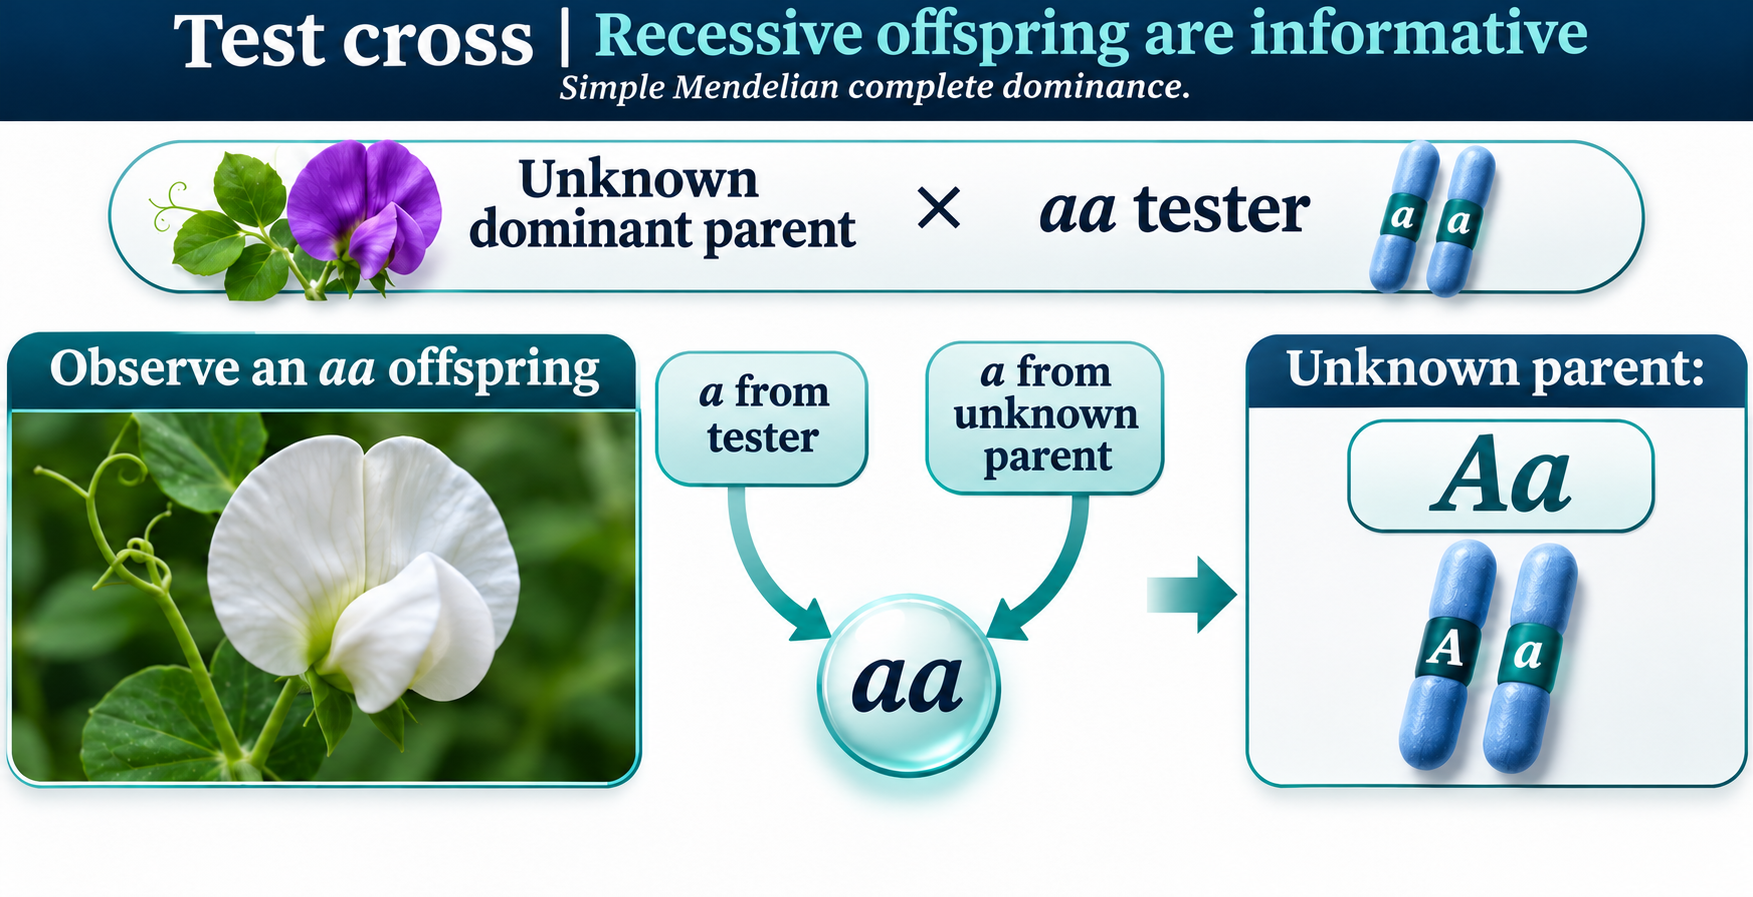
Recessive offspring reveal an allele
An aa offspring demonstrates that the unknown dominant-phenotype parent contributed a recessive allele.
Download original PNG
A small sample is not proof
Four dominant offspring still have a 6.25% chance in an Aa × aa cross.
Download original PNG
Evidence and sample size
The probability of all-dominant offspring from Aa × aa falls as the number of offspring increases.
Download original PNG